Log Management FAQ

Part 1: Implementation Settings

Access Control
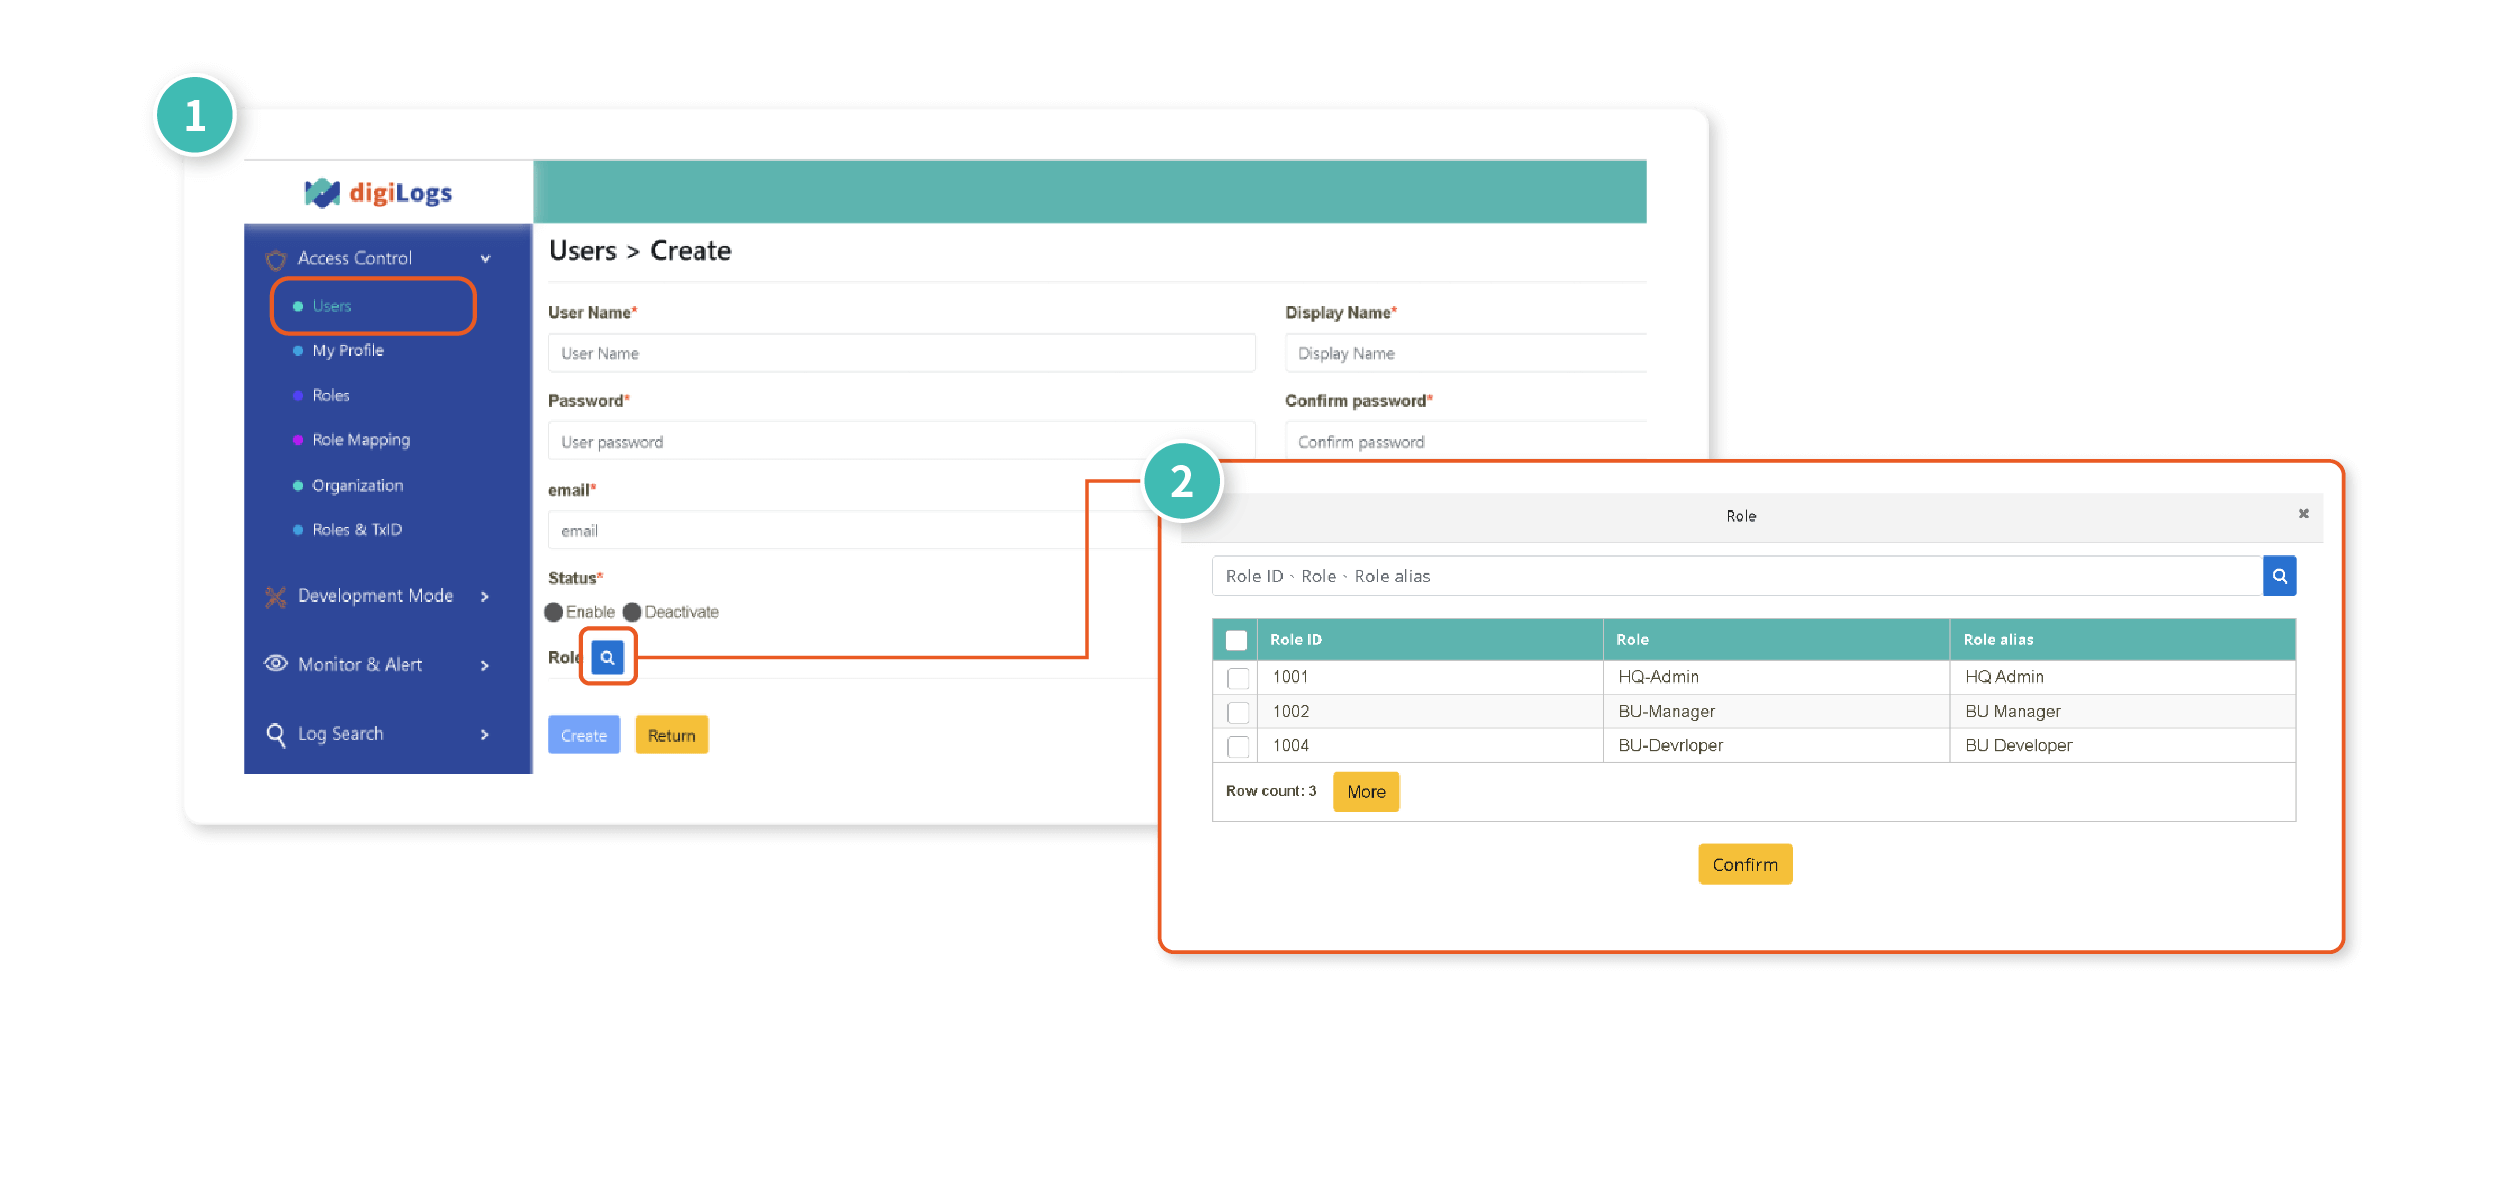
Q: Can we configure different levels of access to use digiLogs for employees with “different job levels” and “different job functions”?

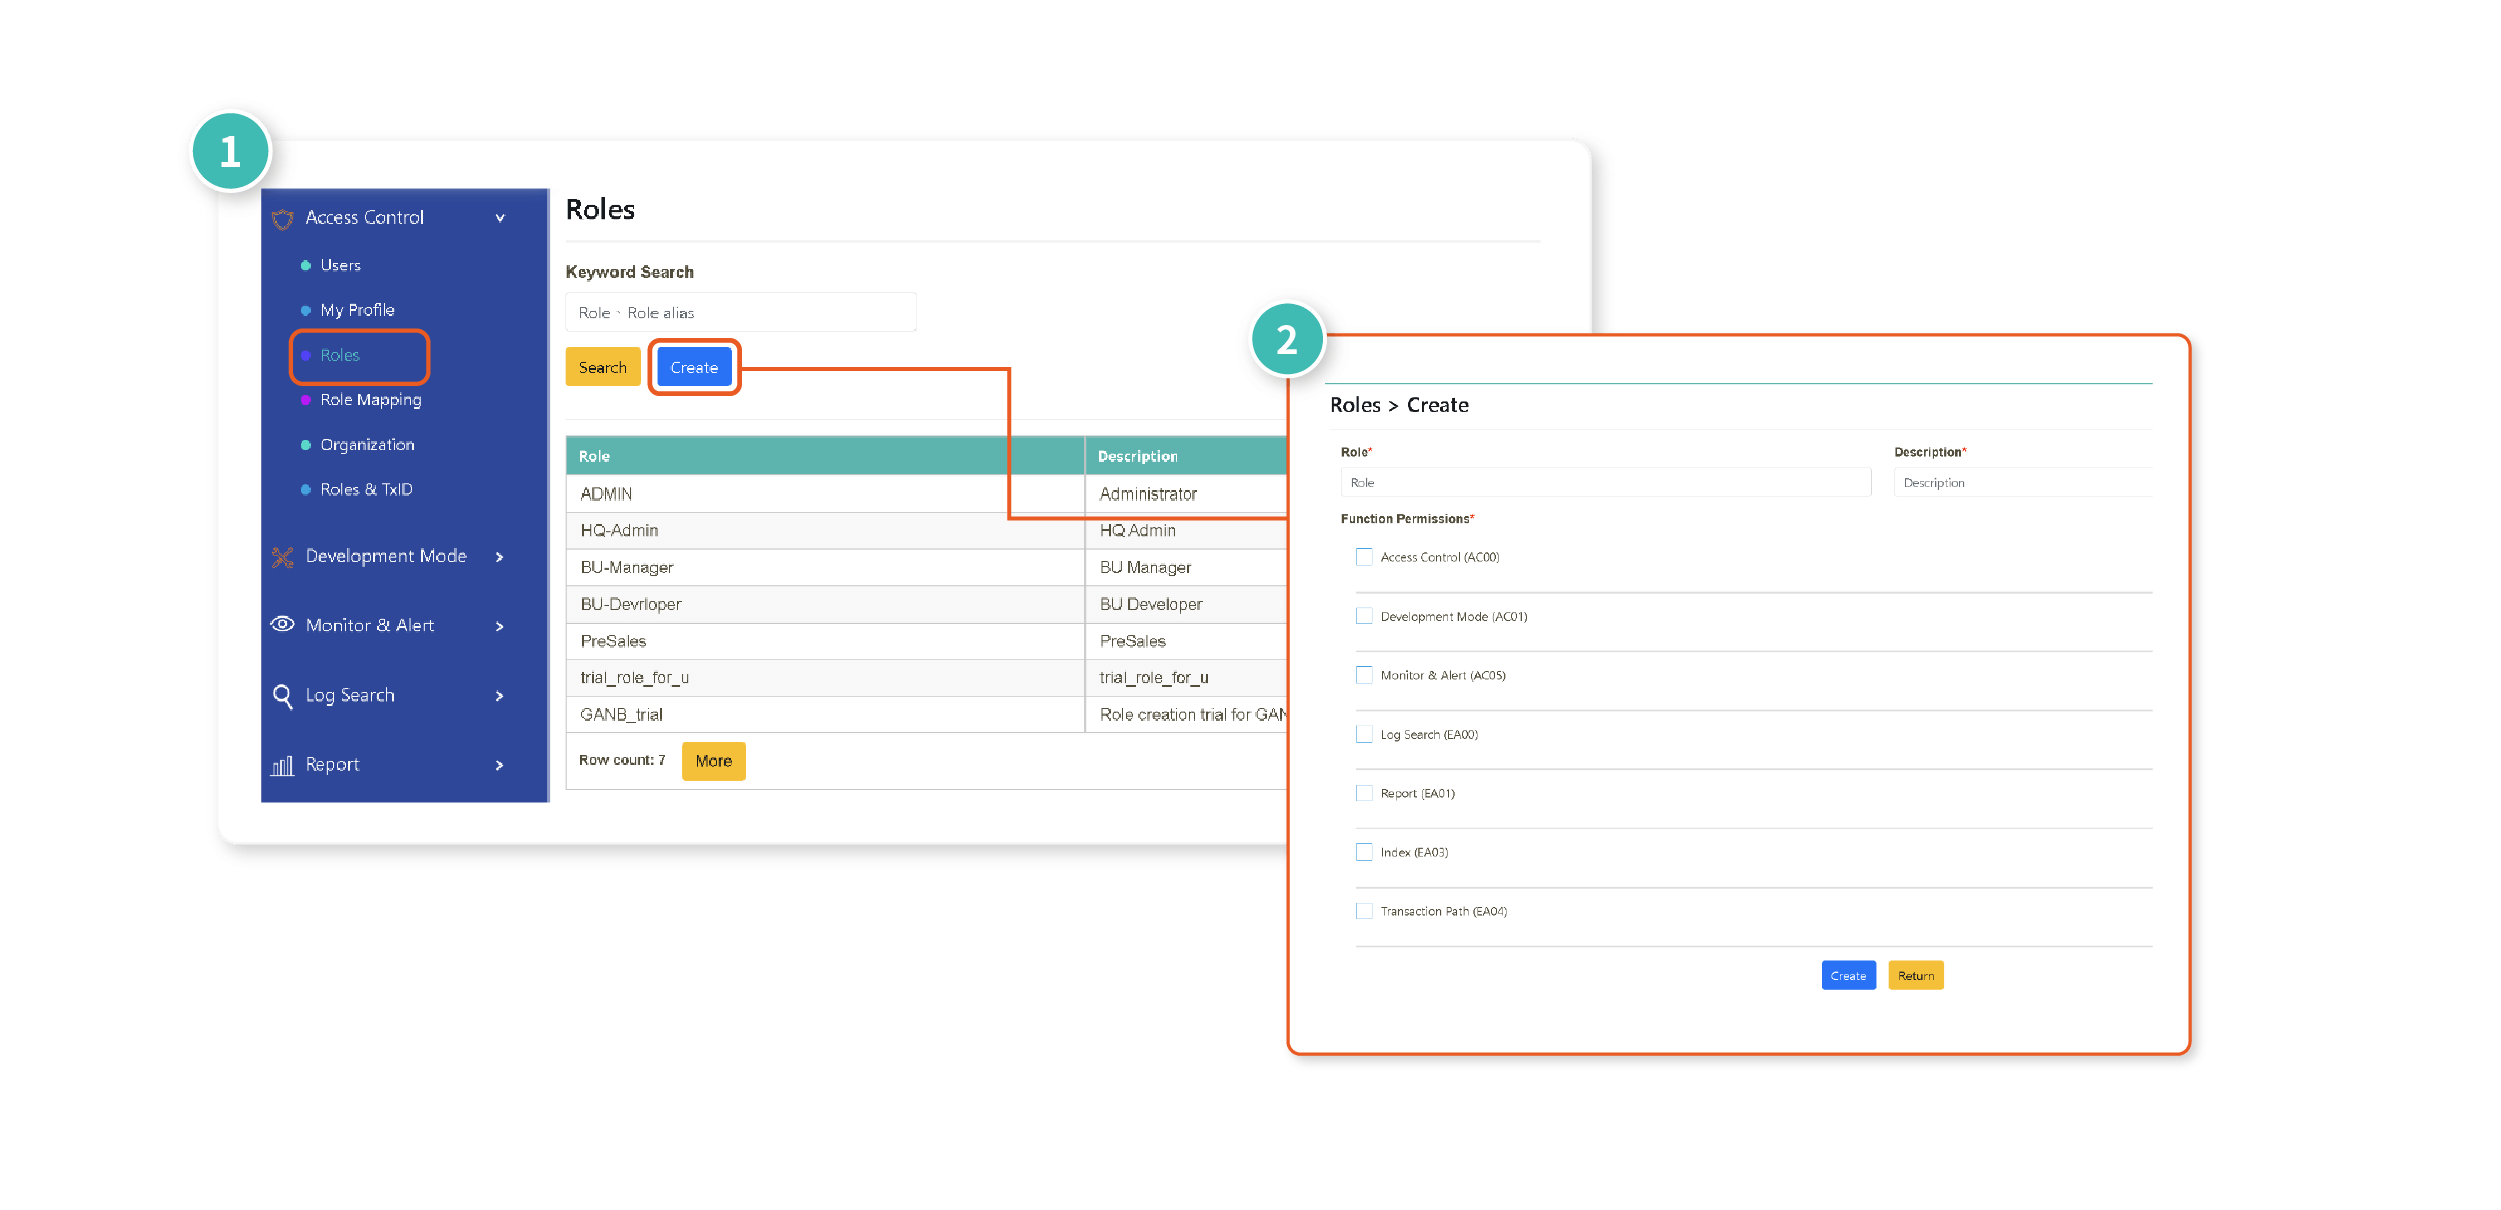
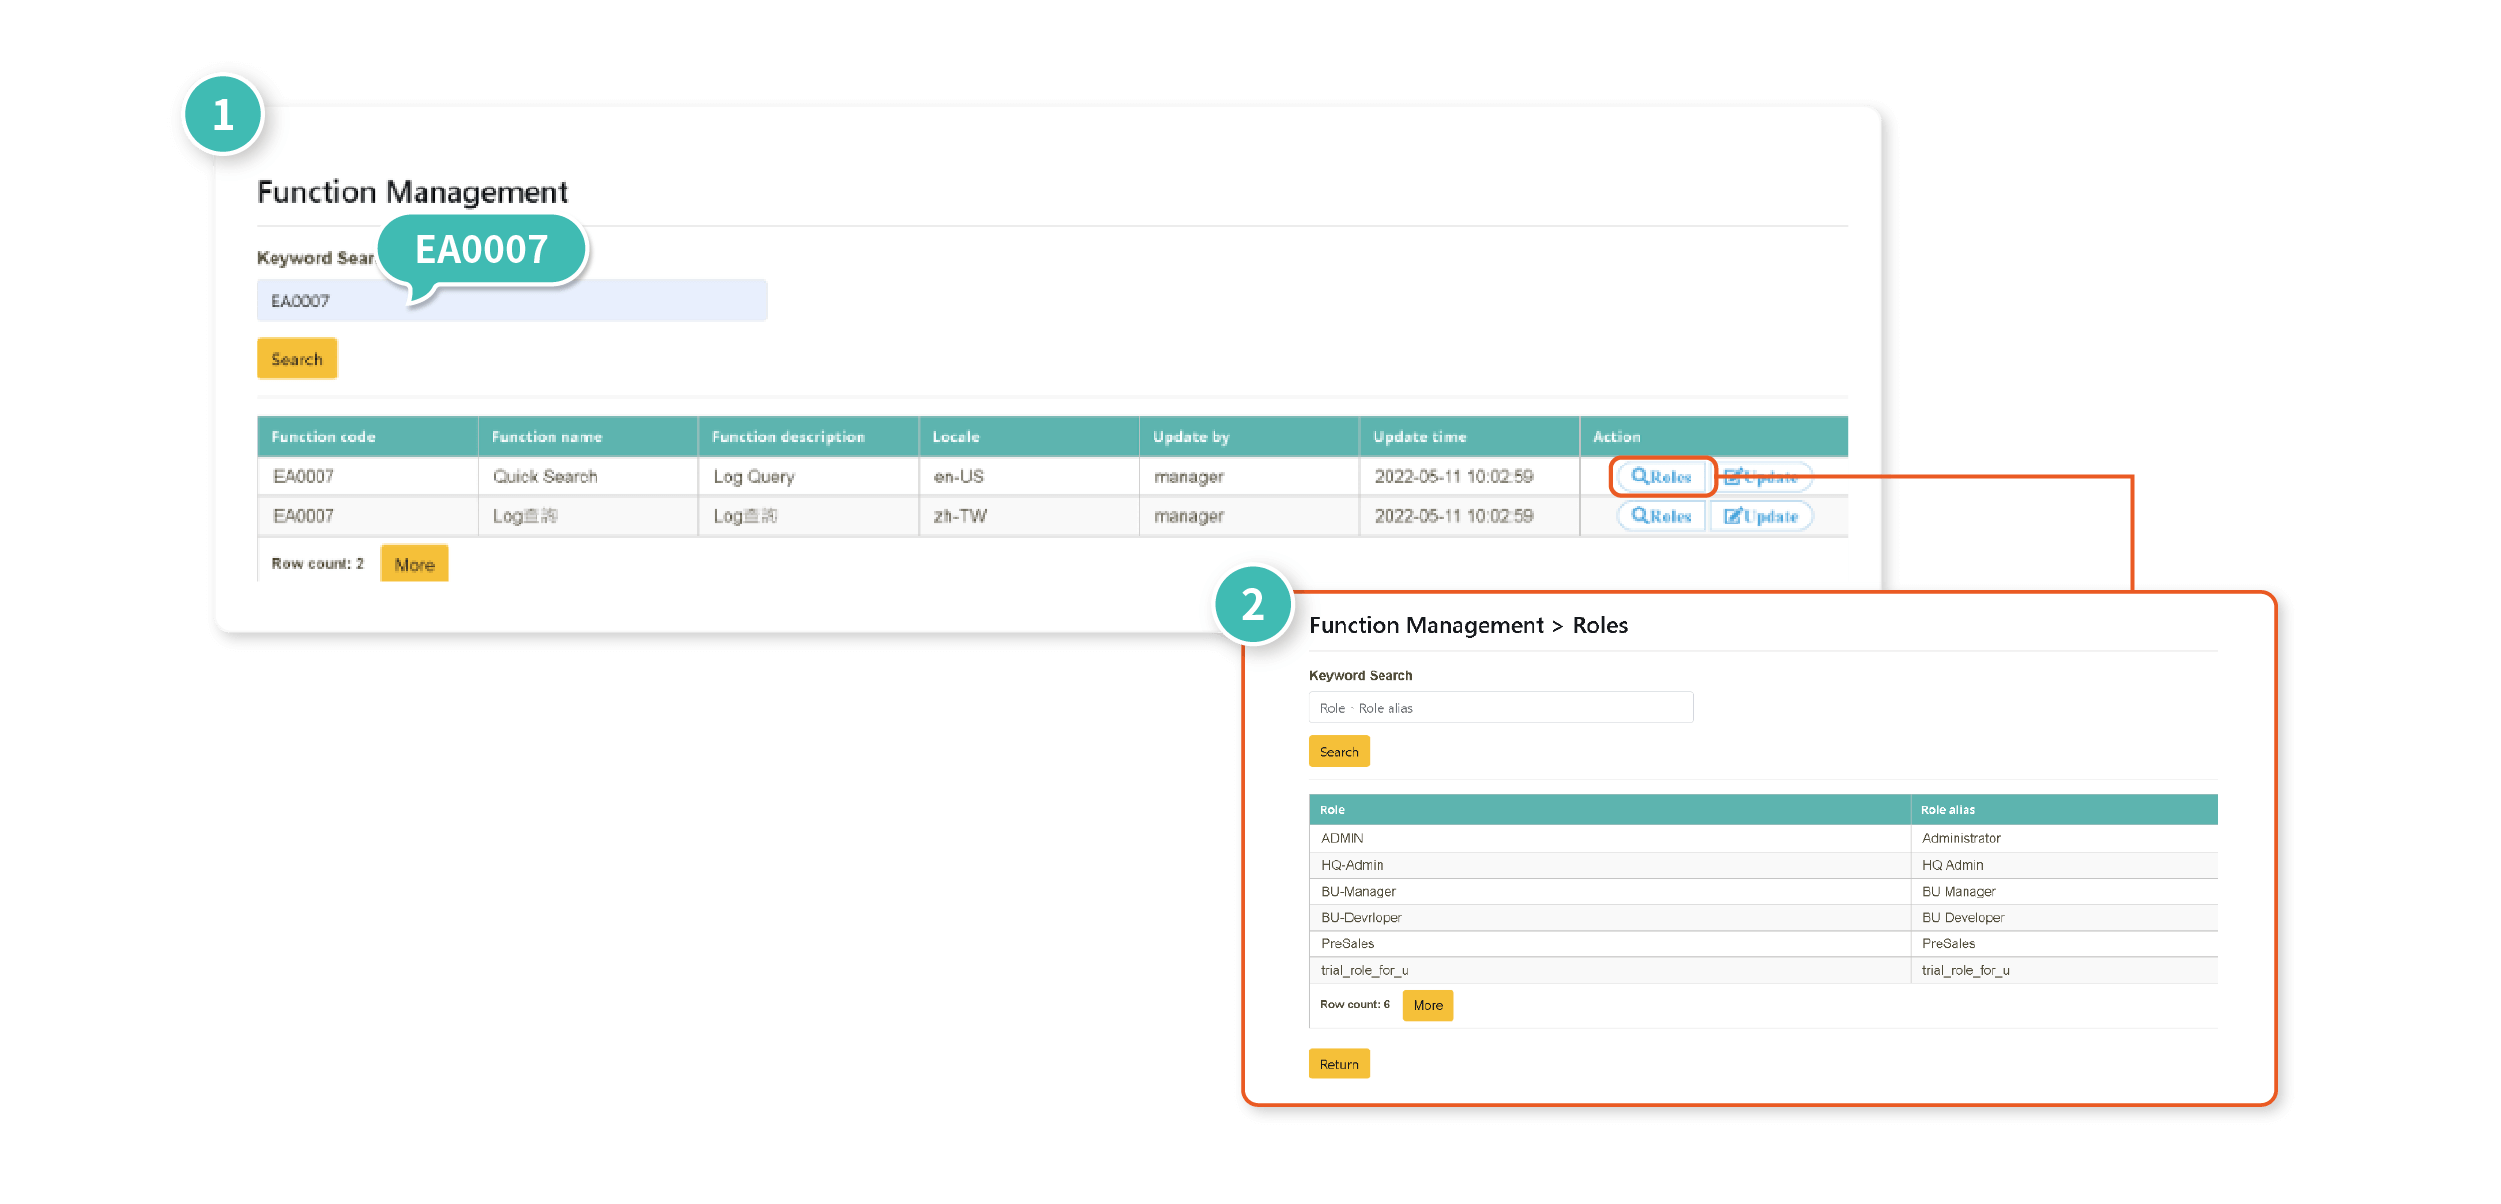
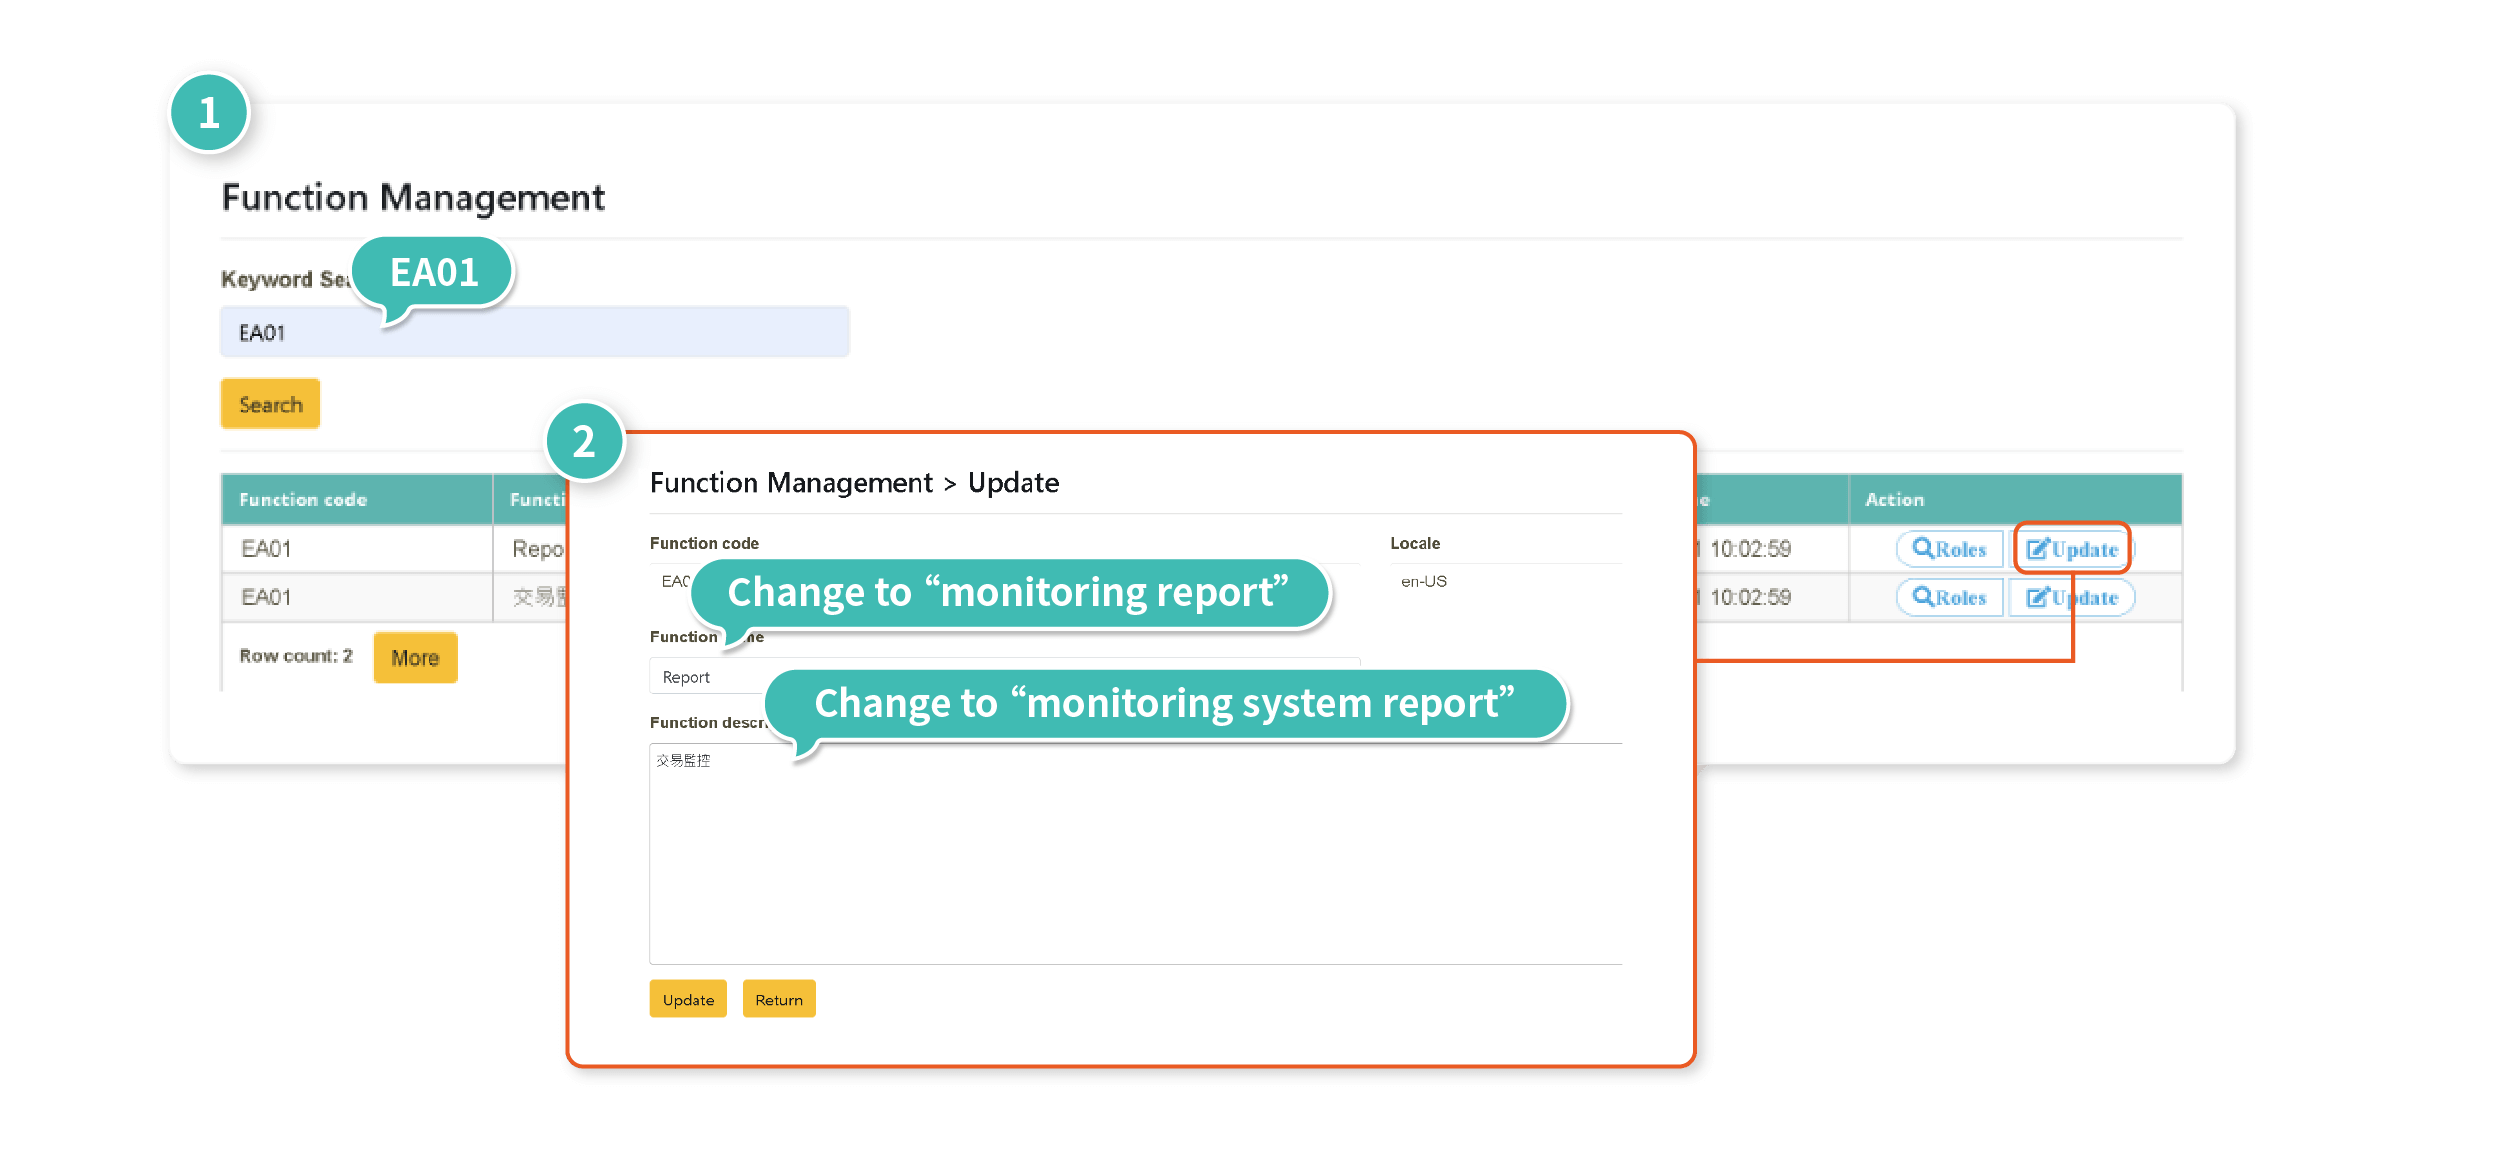
A: Yes, digiLogs allows "roles-based" access settings, which classify users into groups based on roles for access control. For example, when creating users, users can be categorized into groups based on roles such as Admin and IT. Roles can manage "functions," "operations," "data sources," and "sensitive information."

Function Management
Q: I want to know who the users are for each function. Does the platform provide a user overview through the platform function list?

A: Yes, through "Function Search", you can view the list of all digiLogs functions and the users for each function. You can also update the “function name” and “function description”

Part 2: Monitoring

Function Management
Q: I have some concerns about CPU performance recently. Is it possible to understand the current operation status of digiLogs?

A: Yes, through the "digiLogs Server Dashboard," you can quickly know the system's health status, and various indicators of digiLogs, including Heartbeat, Heap, CPU, and Thread Pool.

User Trajectory
Q: Our administrator wants to know the activities of each user using digiLogs. Does digiLogs provide user activity tracking?

A: Yes, through "Audit Logs," you can search for user trajectories and activities by Time Range or criteria such as User, Return Code and transaction ID. There are three shortcuts available: "Log Query," "Login," and "Index Management."

Anomaly Alert [Customizable]
Q: Immediate troubleshooting is imperative for our company when anomalies occur in the systems. Does digiLogs provide alert mechanisms?

A: Yes, through "Alert Settings," you can configure real-time alerts based on specific keywords besides the default Server Node.

    Field Definitions:
  • Alert Name: The name of the alert.
  • System Name: The source of the alert delivery.
  • Keyword: Log field – response value.
  • Status: Enable/Deactive.
  • Type: The type of the event that triggers the alert.
  • Alert Message: The content of the alert message.
  • Threshold, Duration, Alert Interval: Threshold and frequency settings for the alert.
  • Customized Alert: Customize the alert message (customization required).
  • Alert Settings: Selecting the alert delivery time and dates to avoid sending alerts.
  • Alert Recipient: List of target roles to receive the alert.
  • Alert Description: Description and details of the alert.
Transaction Analysis Charts [Customization Required]
Q: In addition to log queries to resolve IT issues, does digiLogs provide charts for visual representation and analysis of transaction performance?

A: Yes, through "Transaction Monitoring", you can select the time range to display the "Average Transaction Time Analysis" and other types of analysis charts.

Transaction Trajectory [Customization Required]
Q: Can I have real-time visibility into the "conditions between different systems" and "transaction information" when an anomaly occurs?

A: Yes, through the "Transaction Path" you can instantly visualize the "system types," "transaction types," and average transaction times across different systems. The status will be displayed in red when an issue occurs, and you can click to view the information of the contact person.

Part 3: Log Search

Dynamic Field Query (& Sensitive Data Masking)
Q: Besides full-text search, can I obtain precise query results by searching specific field data?

A: Yes, through "Log Search", you can perform more accurate log queries by specifying the time range, data source, advanced query conditions, query logics and more.

Correlation Query
Q: If I can't identify any issues from the log query results, is it possible to know the "correlational information" based on the query results?

A: Yes, click "Search" after setting the conditions for the log query and you can analyze each log entry to identify specific keywords. You can retrieve related log data from other sources and access transaction information from various systems.

Sequential Log Query
Q: Is it possible to understand the sequential related logs in chronological order for a single log entry?

A: Yes, click "Search" after setting the conditions for the log query; click "More" in the last column of each log entry, and you can specify the "time range" to retrieve the sequential logs to identify the root cause of system anomalies.

Historical Data Query
Q: Besides recent data, can I search for historical data log time ago?

A: Yes, digiLogs stores data based on the duration of time and categorizes it into hot and cold data. Hot data refers to recent data that can be directly queried, while cold data refers to older historical data. You can use "Index Search" to reactivate and query the cold data.

Read File
Q: Can I use digiLogs to directly view the log files on the host I want to monitor, using commands like "cat" or "tail"?

A: Yes, by configuring the corresponding IP and directory in the Read File settings, you can use the platform to view the log files of all hosts.