In the Logs management scenarios, you can find out the requirement cases of the 12 functions that are normally managed by the Logs management in your organization from three main aspects (build configuration, monitoring, and search). These scenario demonstrations can serve a role to better assist the enterprise in applying these scenarios in its own organization.
XX Information is a technology company that provides “information system integration and build services”. It also develops enterprise information systems and terminal equipment integration information platforms. And through IT system monitoring and analysis, it helps to maintain the company’s regular business and services and achieve stable system operation.
Manager Wang is the manager of XX Information’s information technology department. He is in charge of the technology development and MIS departments. Multiple sets of software systems and hardware equipment are used to meet the maintenance and development needs of the company.
Manager Wang discovers that IT is often the last to be notified when system anomalies occur, which is too passive. Most of the time, due to the exceeding amounts of devices in the system and the nature that Log data are stored in a scattered manner. Much time is wasted to discover the problems manually. In addition to that, the amount of data in question, inconsistent field formats, and little correlation among the settings greatly increase the difficulty of discovering the problems concerning time and effort.
To locate the sources of system anomalies with speed and accuracy, Manager Wang decided to introduce the digiLogs centralized management platform as the company’s Logs management center so that he can manage system data records of various software and hardware easily through a single interface, reduce the time cost for the team to discover the problems and improve management efficiency effectively. Among all, MIS, the development team, and the management are members of the organization that need to use the Log centralized management platform more often.
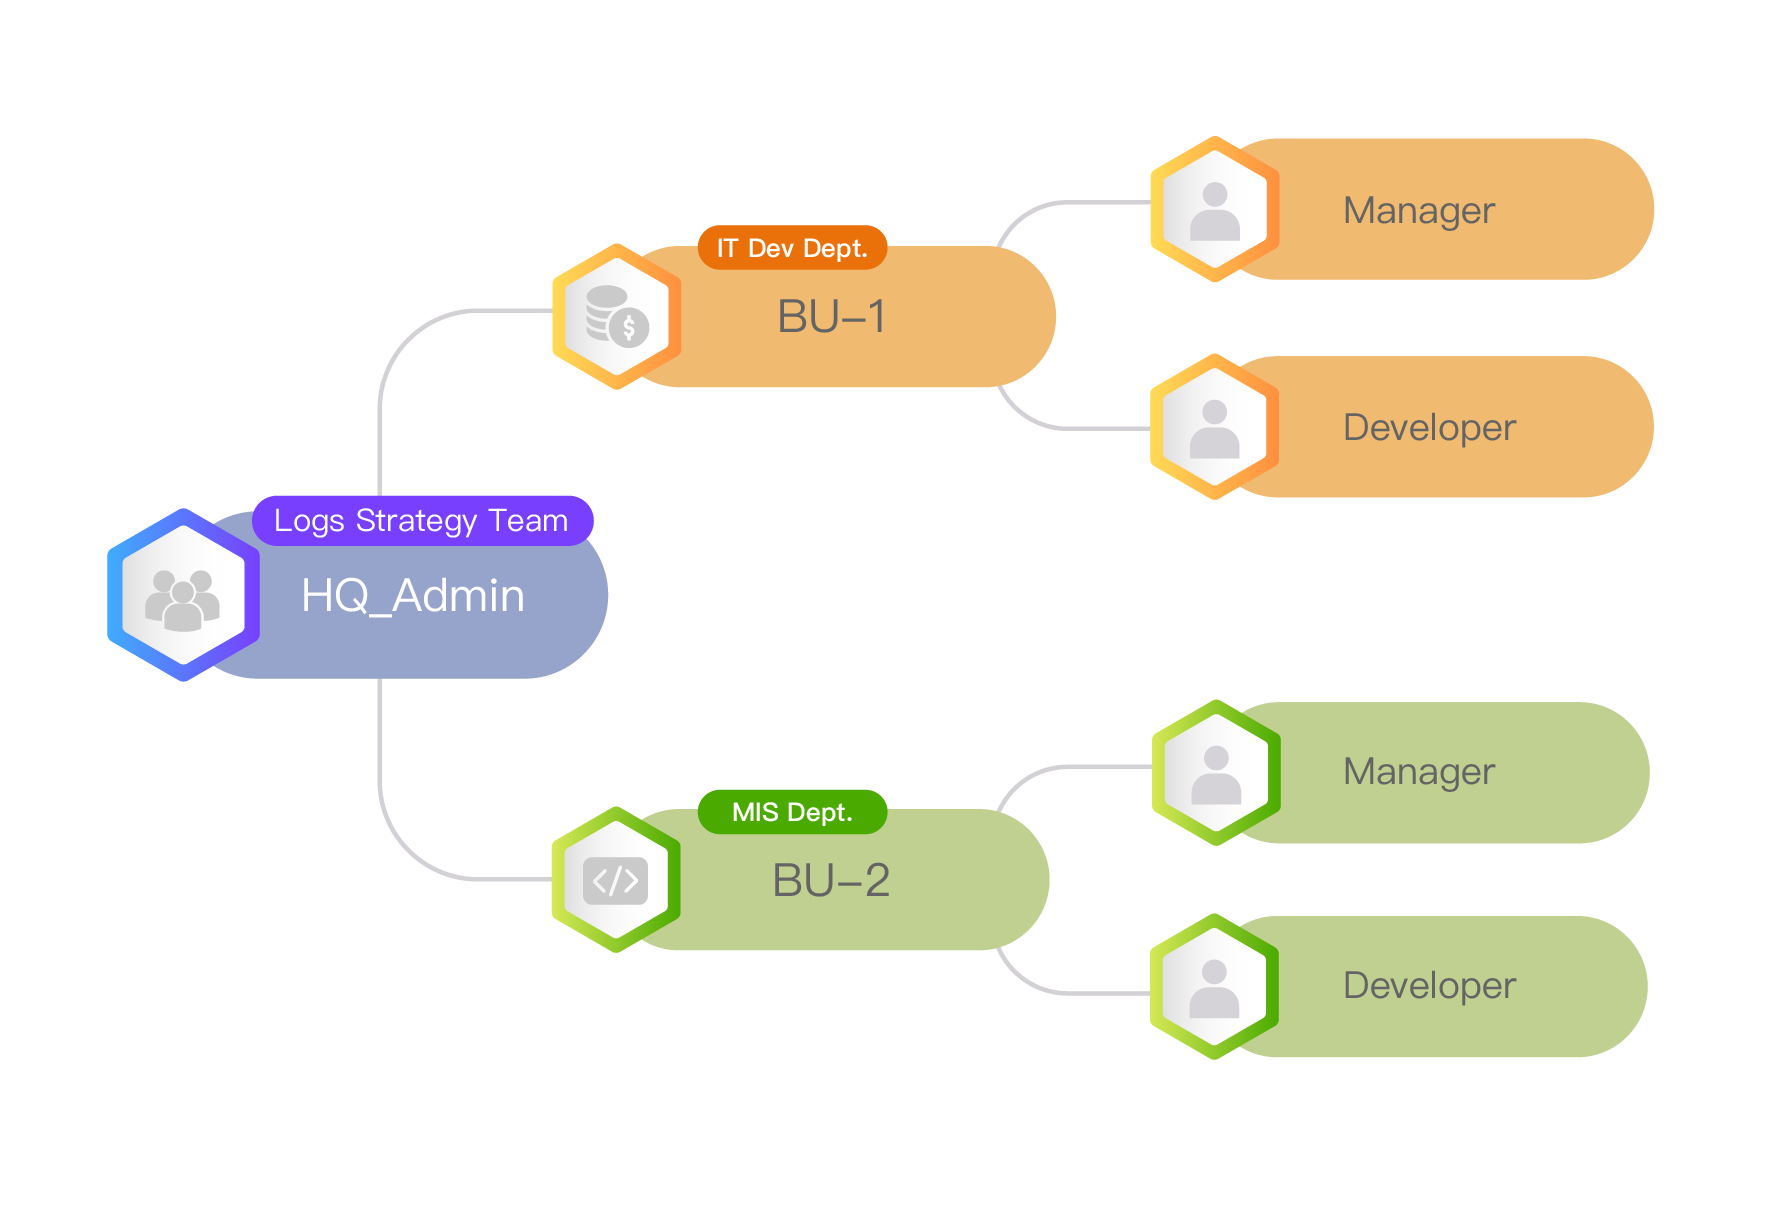
The IT development and MIS departments hope to use digiLogs as a centralized Logs management platform for their software systems and hardware equipment. Both departments hope to have their own organizational access regulations and each needs different functional modules for members of different job responsibilities (Manager, Developer) to execute corresponding tasks.
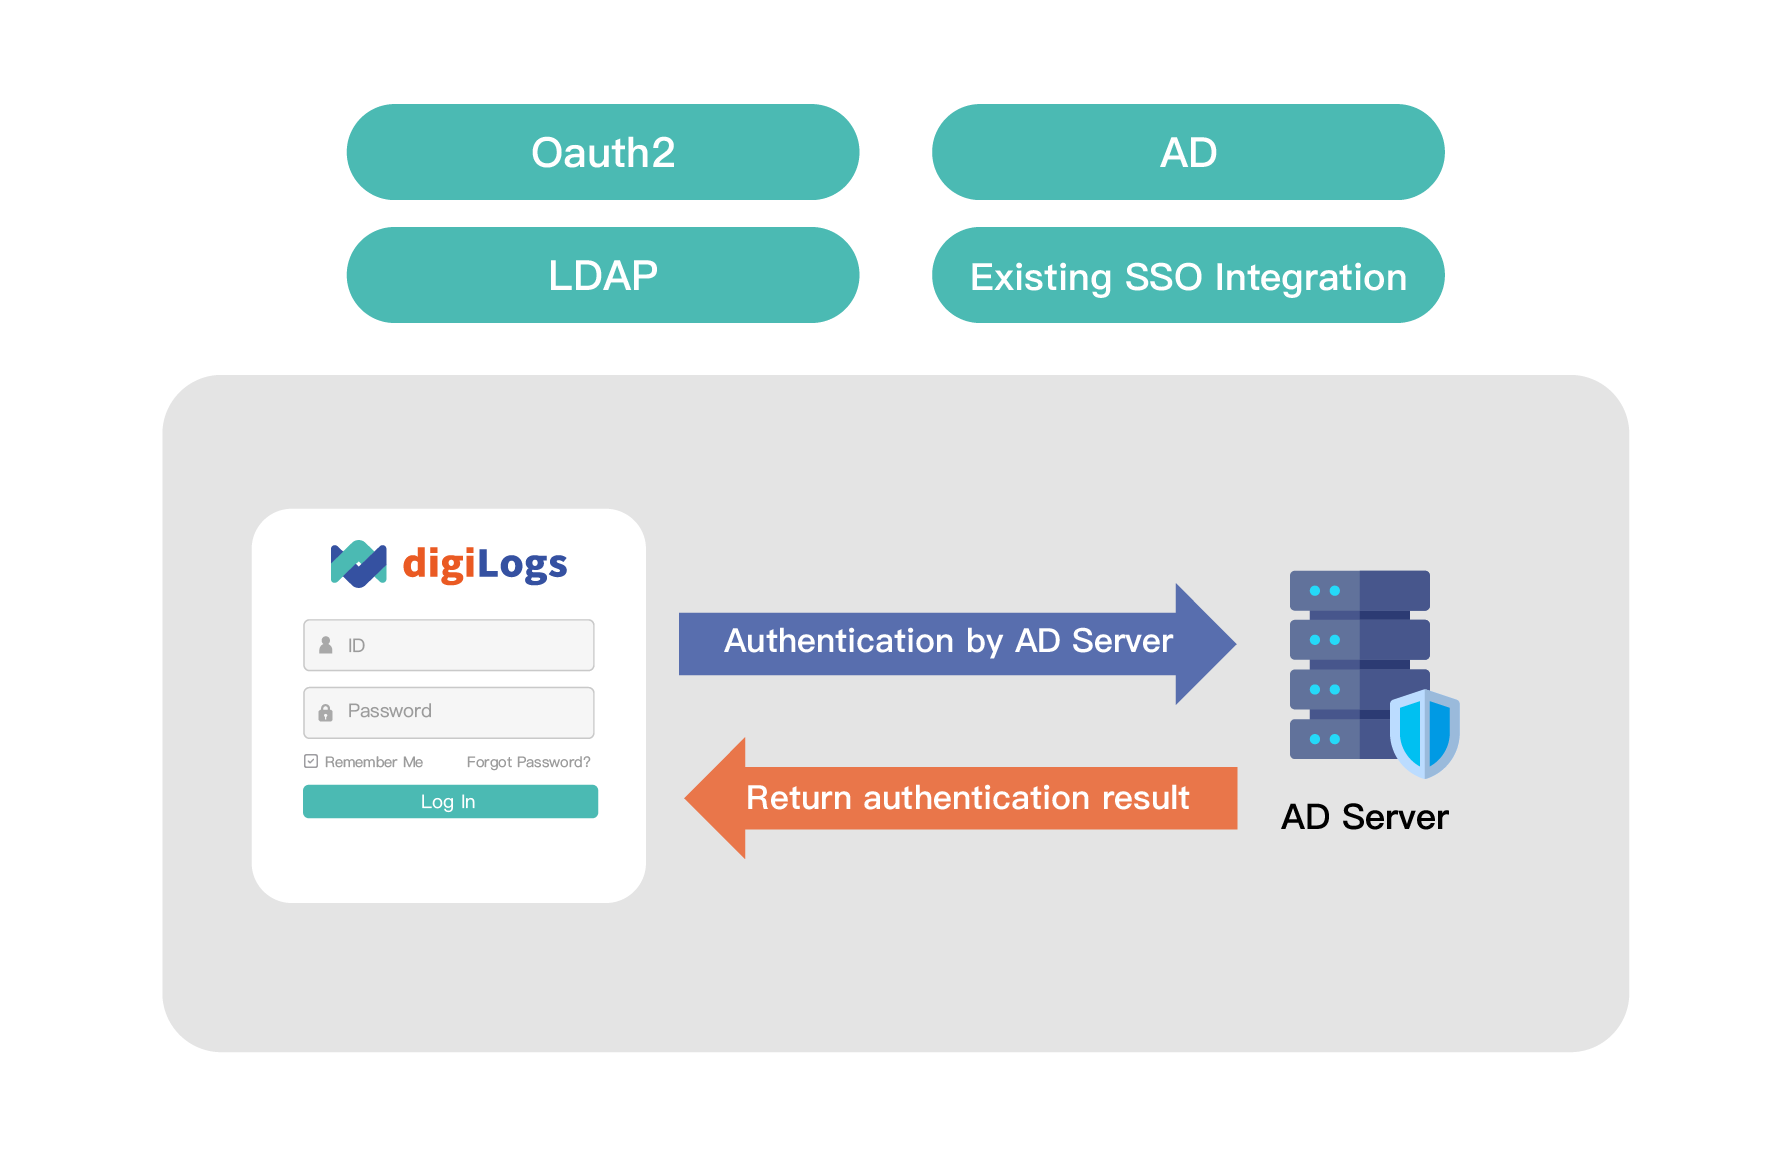
Integrated System Authentication Login: It supports Oauth2, LDAP, AD, and integrated SSO mechanisms. The process mainly uses AD Server for identity authentication and achieves successful login if the AD Server returns the authentication result. In digiLogs, if the management environment is partitioned and a quick environment switch is preferred, you can click on the “Redirect Page” on the login screen or the “User Icon” on the upper right-hand side of the platform to select the intended environment.
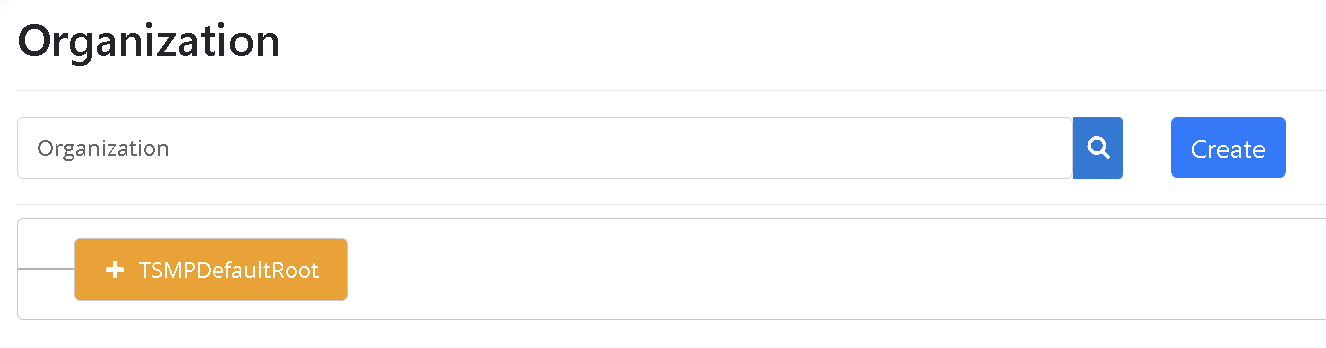
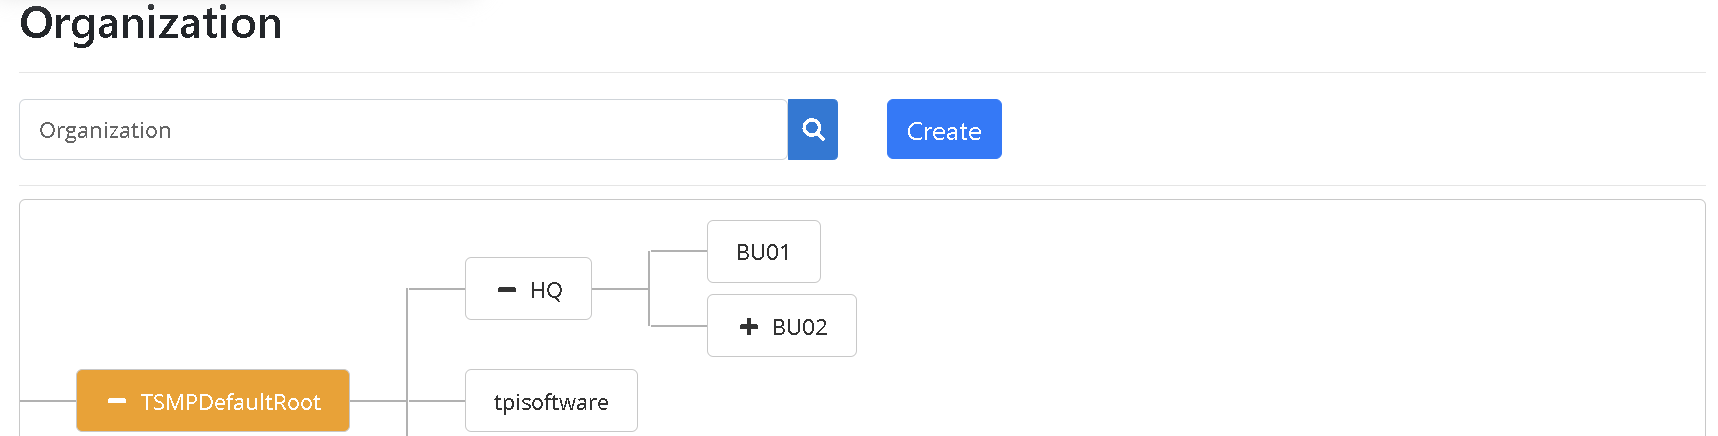
Click on “Access Management” > “Organization Maintenance” to create a new organization.
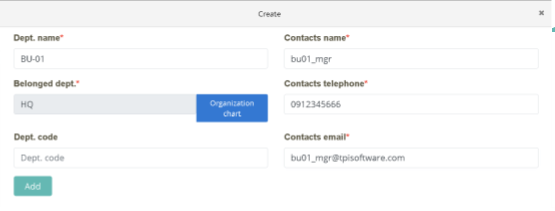
Enter the information regarding the organization to be built (BU-01, bu01_mgr) and click [Create] to create a new organization node.
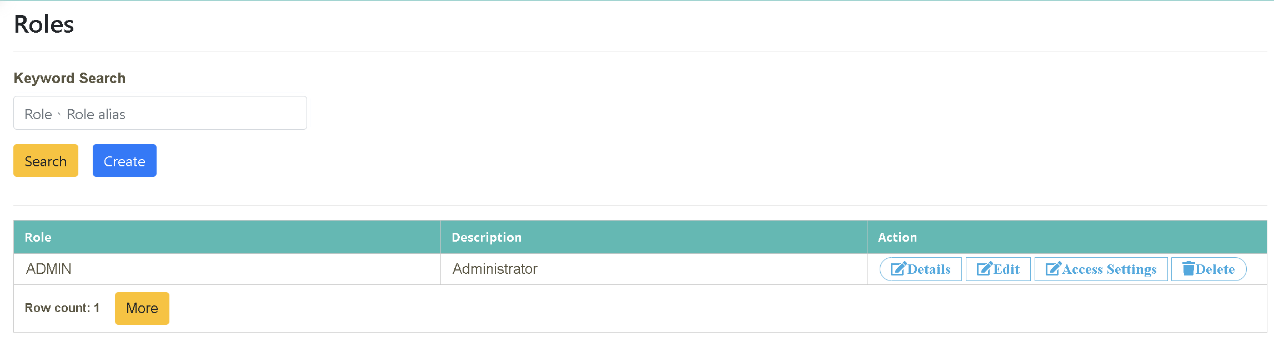
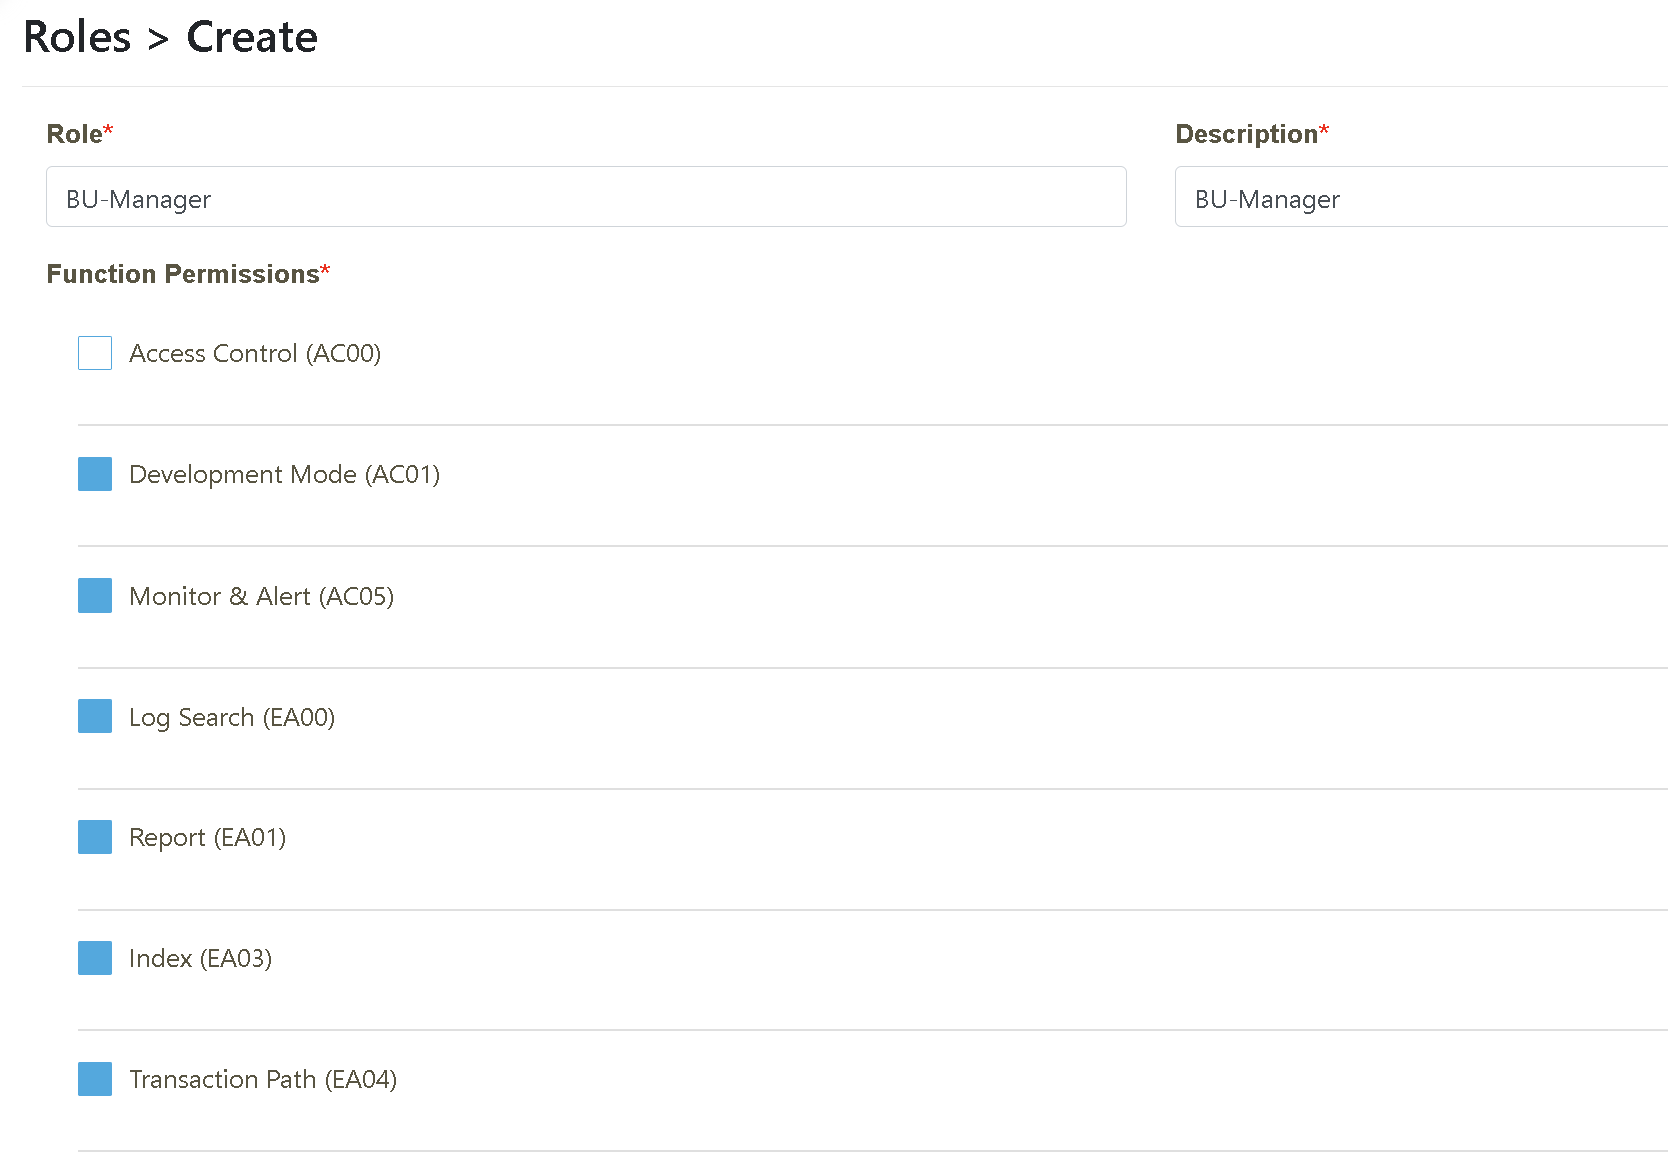
Enter “Role Code” and “Role Name” (BU-Manager) and click on the “Function List” to choose new functions for this role. Then, click [Create].
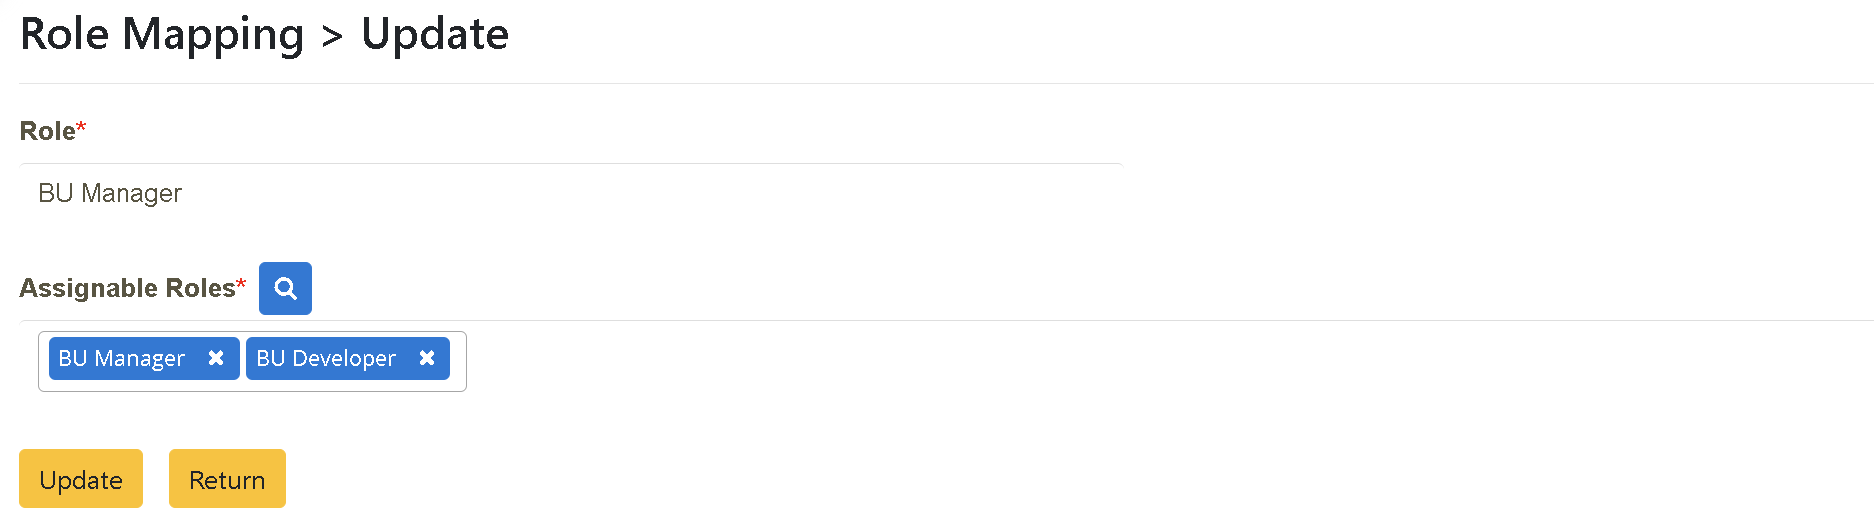
Click on “Access Management” > “Set Up Role List” to grant assignable roles to “BU_Manager”. List of Assignable Roles: BU_Manager, BU_Developer
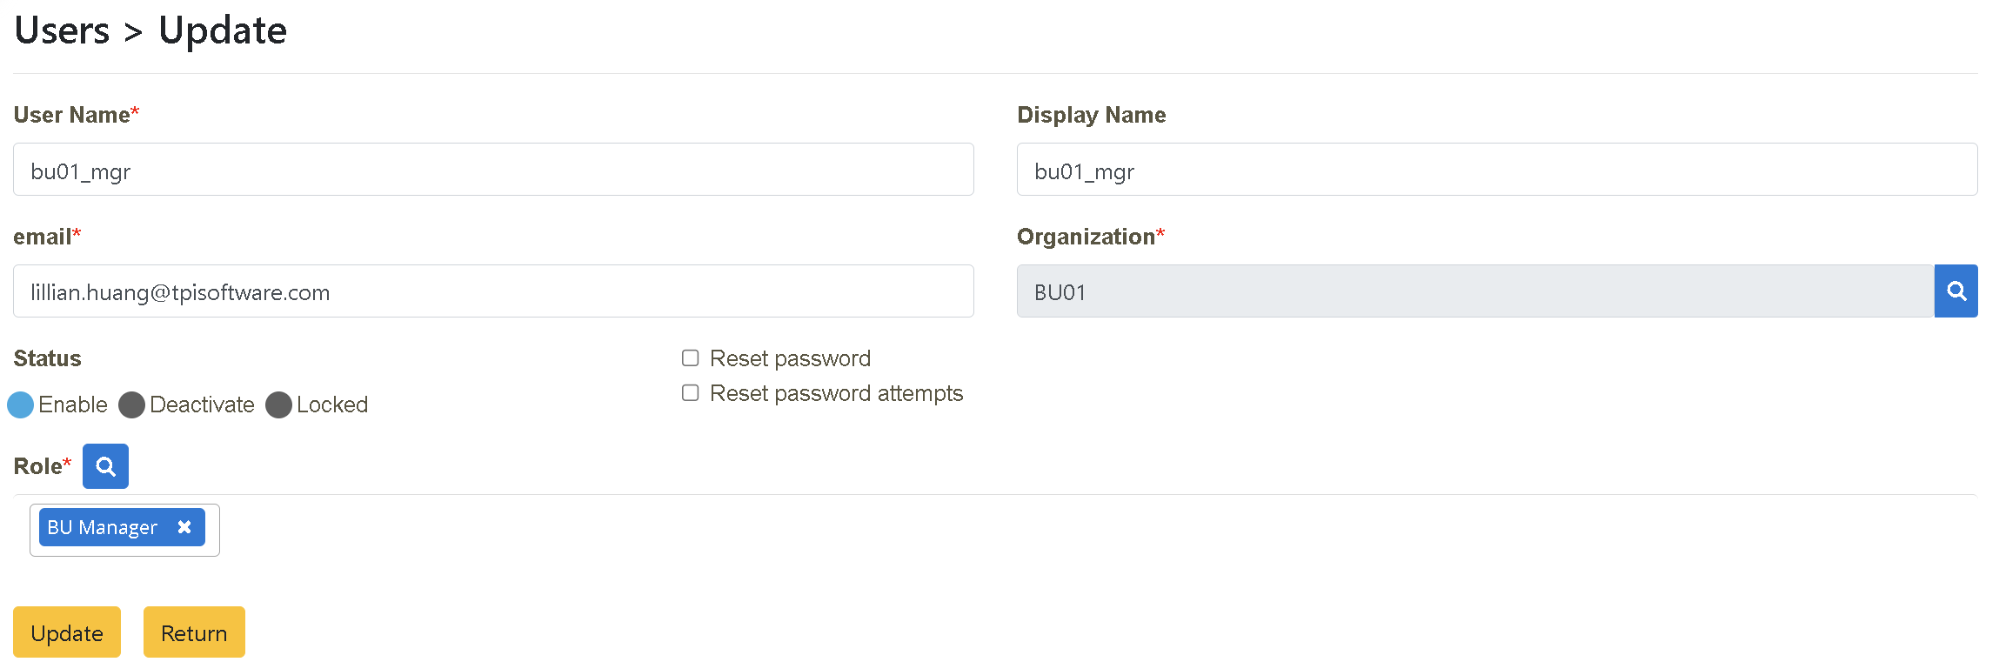
Click on “Access Management” > “User Maintenance” to create a new user: bu01_mgr under BU-01 organization and grant the newly added role to the new user for him to use the functions assigned to the role.
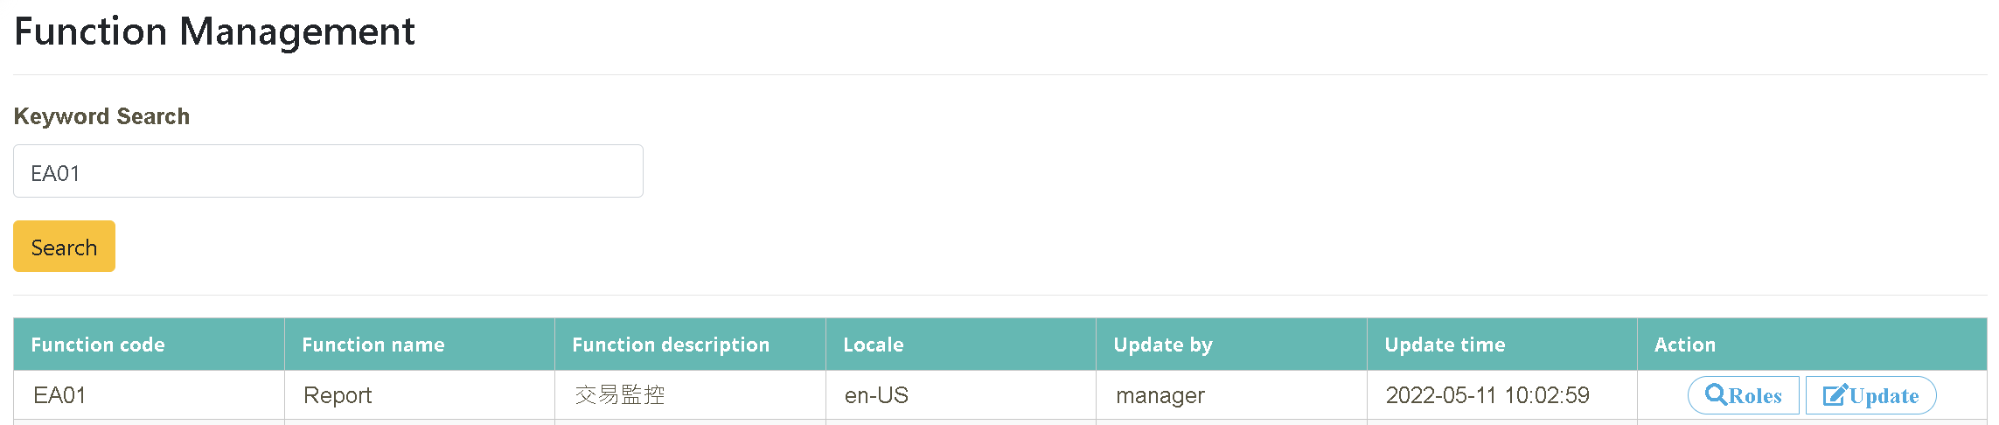
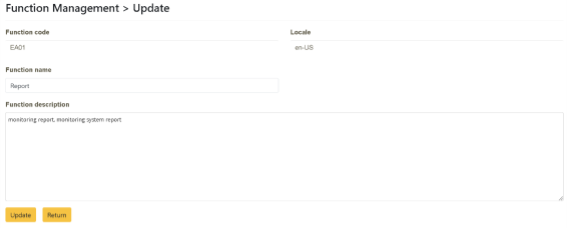
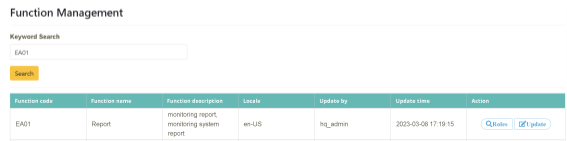
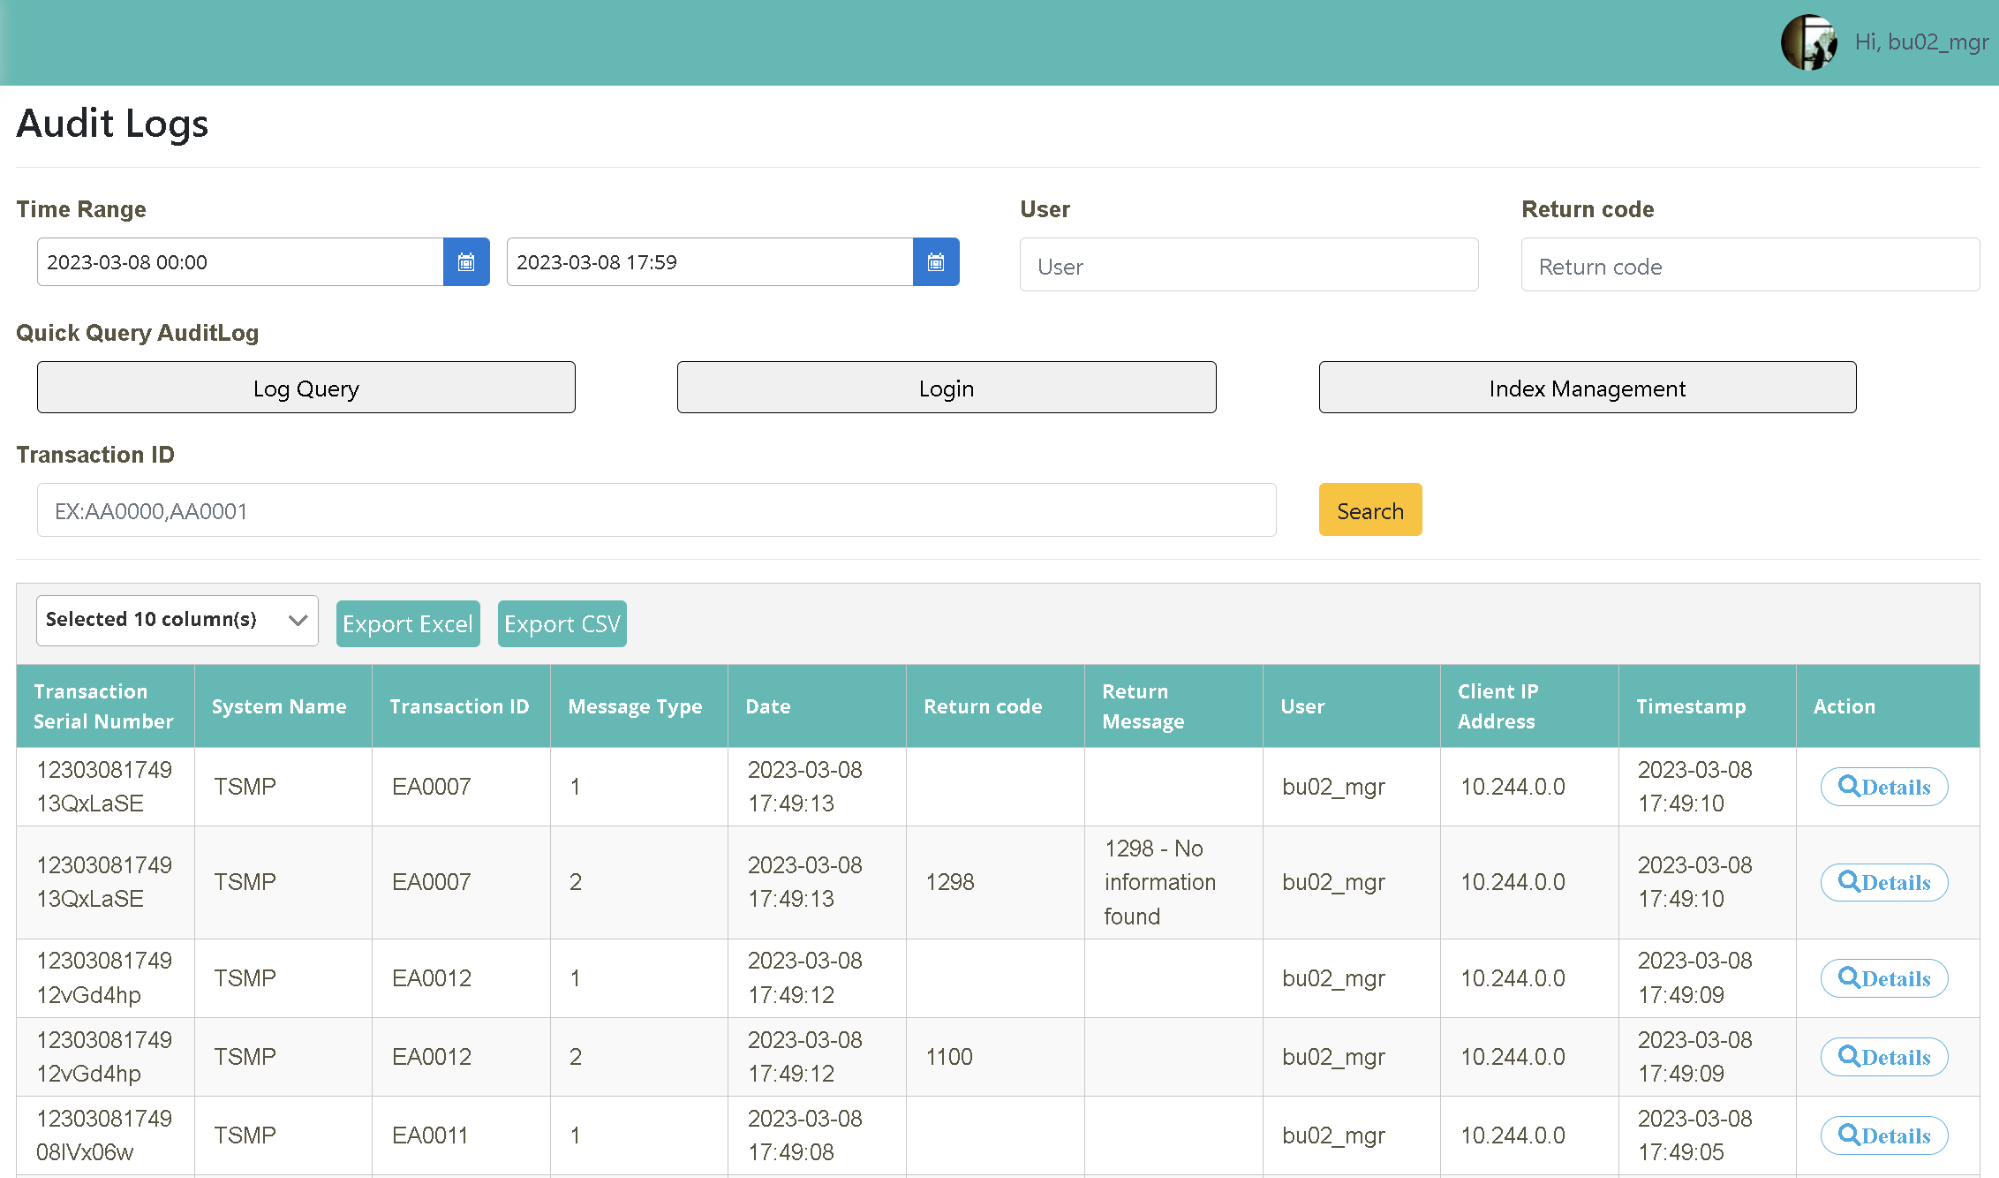
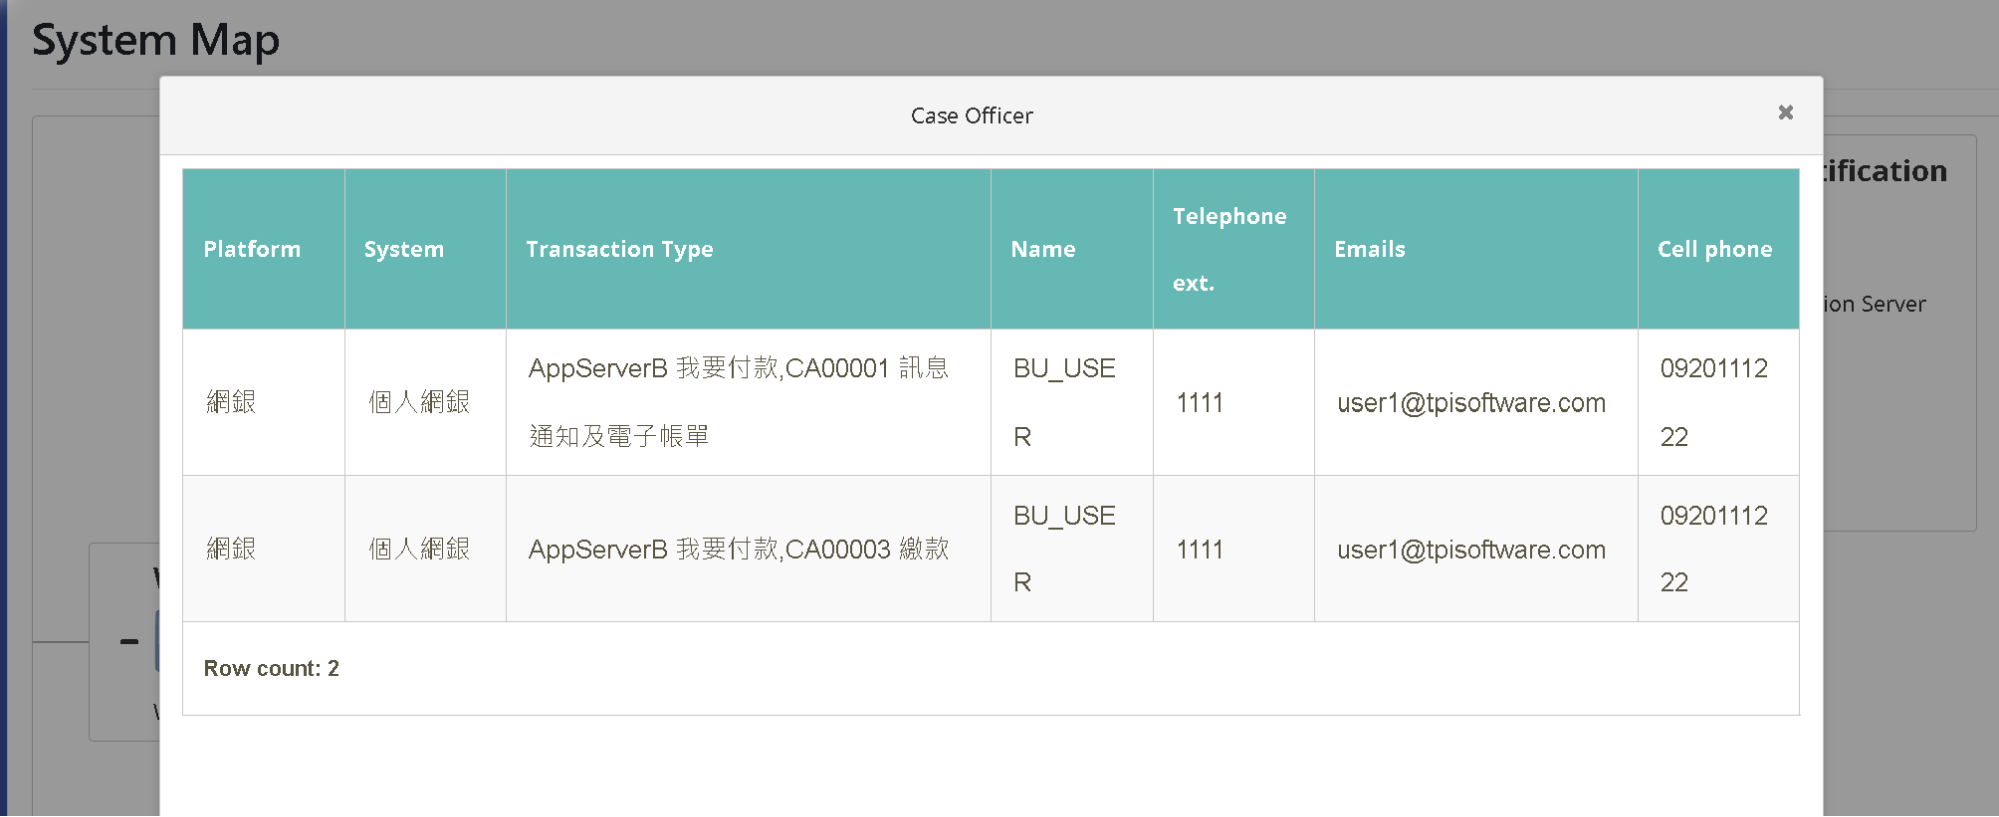
In this scenario, you can find out how to perform a quick search on the “associated users” from the “function bar” in digiLogs, and how to adjust and update the “function description” according to the industry’s idioms or preferred terms.
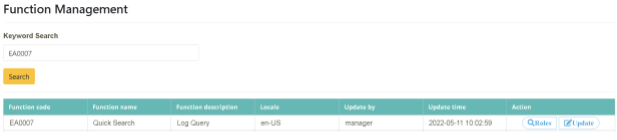
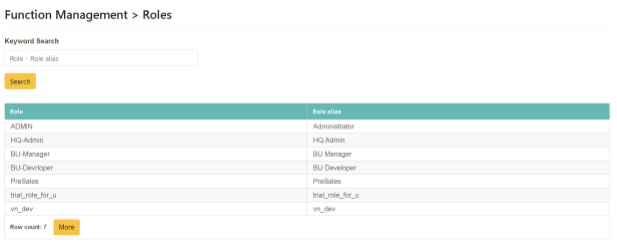
Log in as bu02_mgr. Click on “System Function Management” > “Function Maintenance” and enter the information to be searched (Function Code or Function Name, EA0007). Click on “Action” > [Associated Role] to get a list of qualified roles.
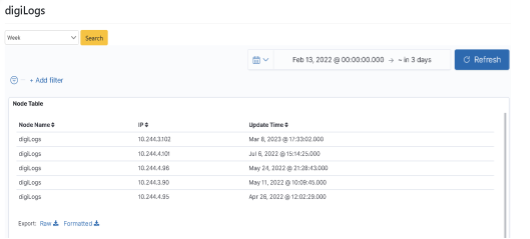
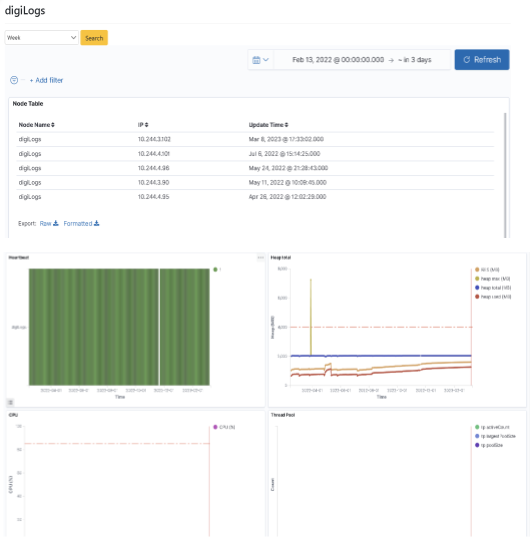
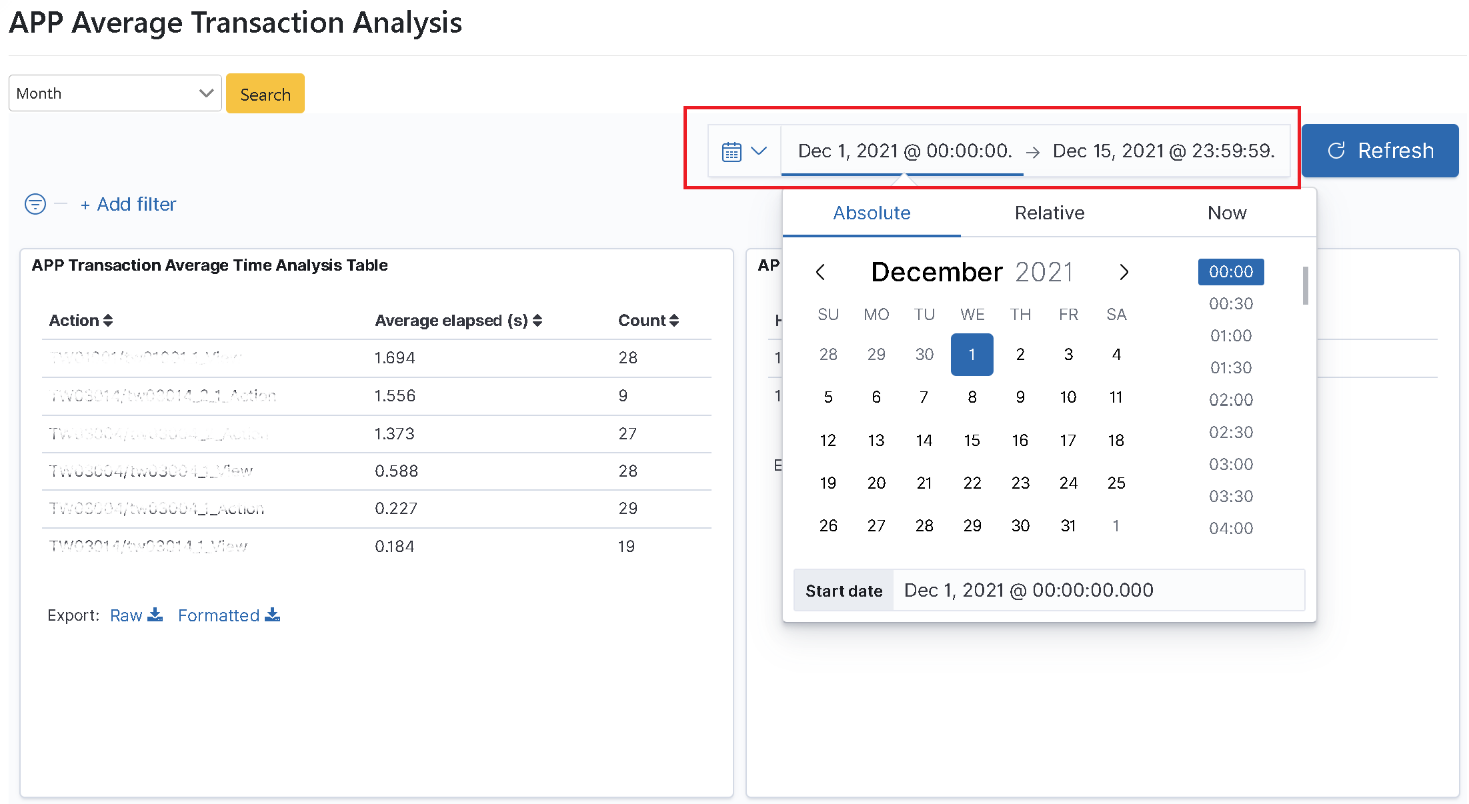
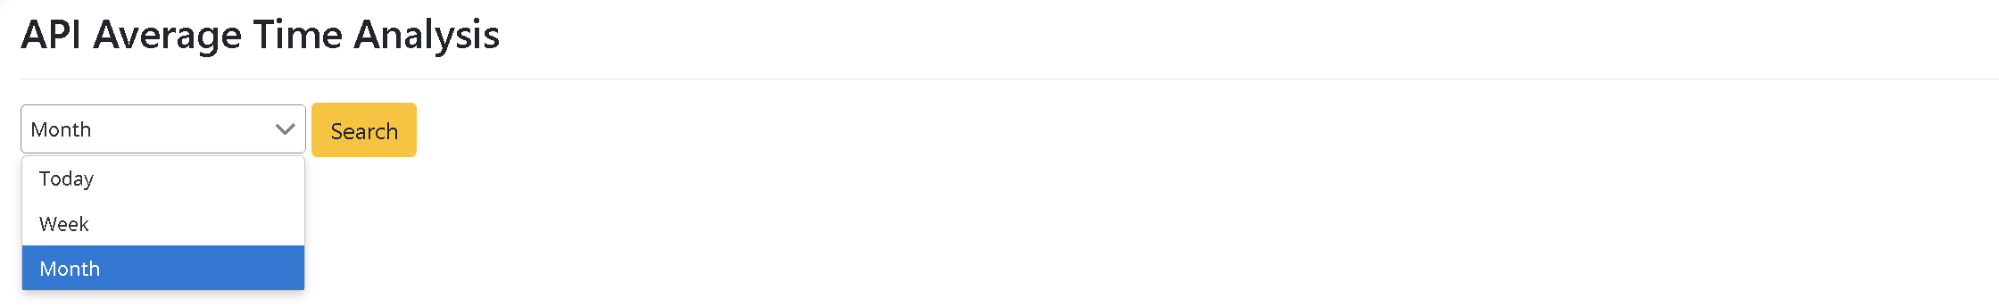
Click on “Monitoring Management” > “digiLogs Server Dashboard” to select the time interval (Month) to be searched. Select “Start Time” and “End Time” (using Absolute) in the function box on the right-hand side of the “Calendar” icon and click [Update].
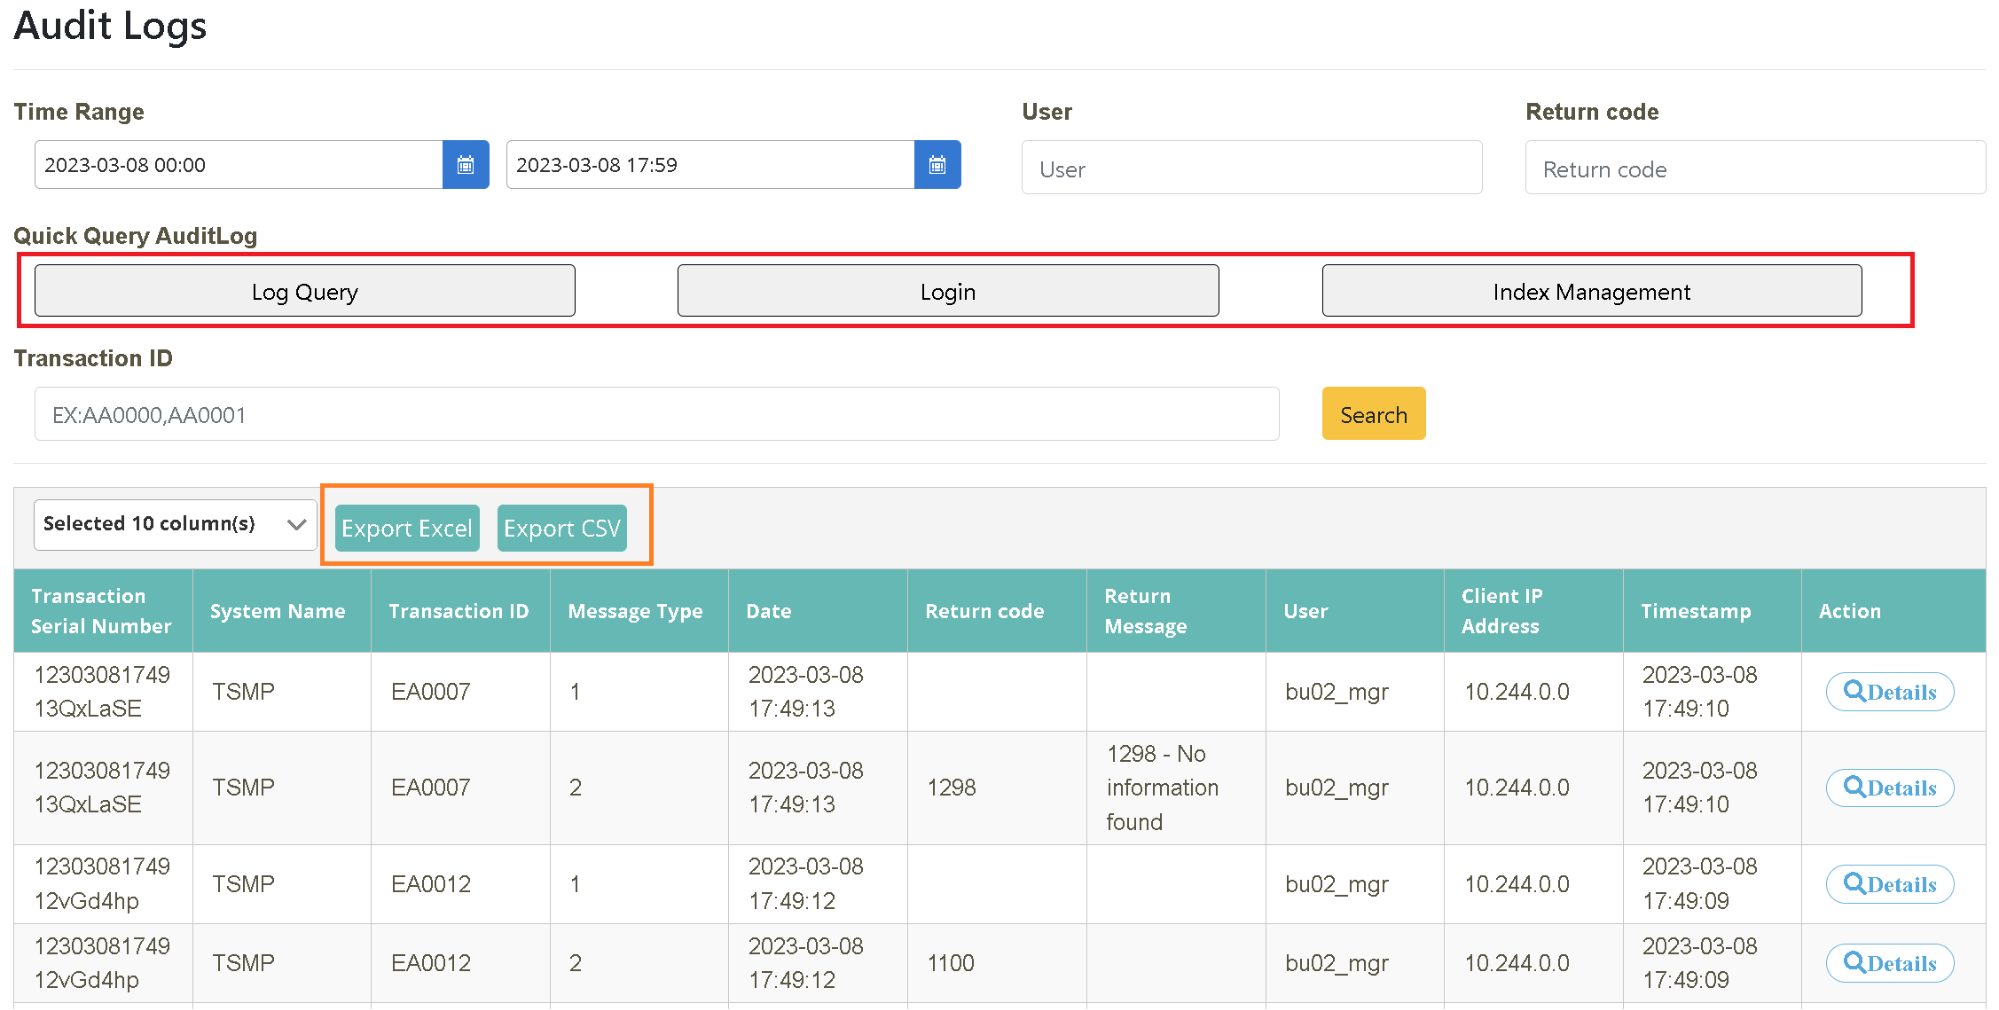
Due to the management needs, MIS director Alex needs to monitor the usage status of the digiLogs platform and spot-check the detailed operation behaviors of specific users randomly. It is time now to perform a routine spot check. He can search either all users or specific users from the “Audit Log” on the platform with a list prepared in advance. For this time, he wants to search and review the overall usage status in December and spot-check the usage tracks of IT developers, such as Joe et al.
After logging in as bu02_mgr, click on “Monitoring Management” > “Audit Log” to select the “Start Time” (2021-12-01) and “End Time” (2021-12-31) as the time interval to be searched on, and click [Search] to obtain all behavior details.
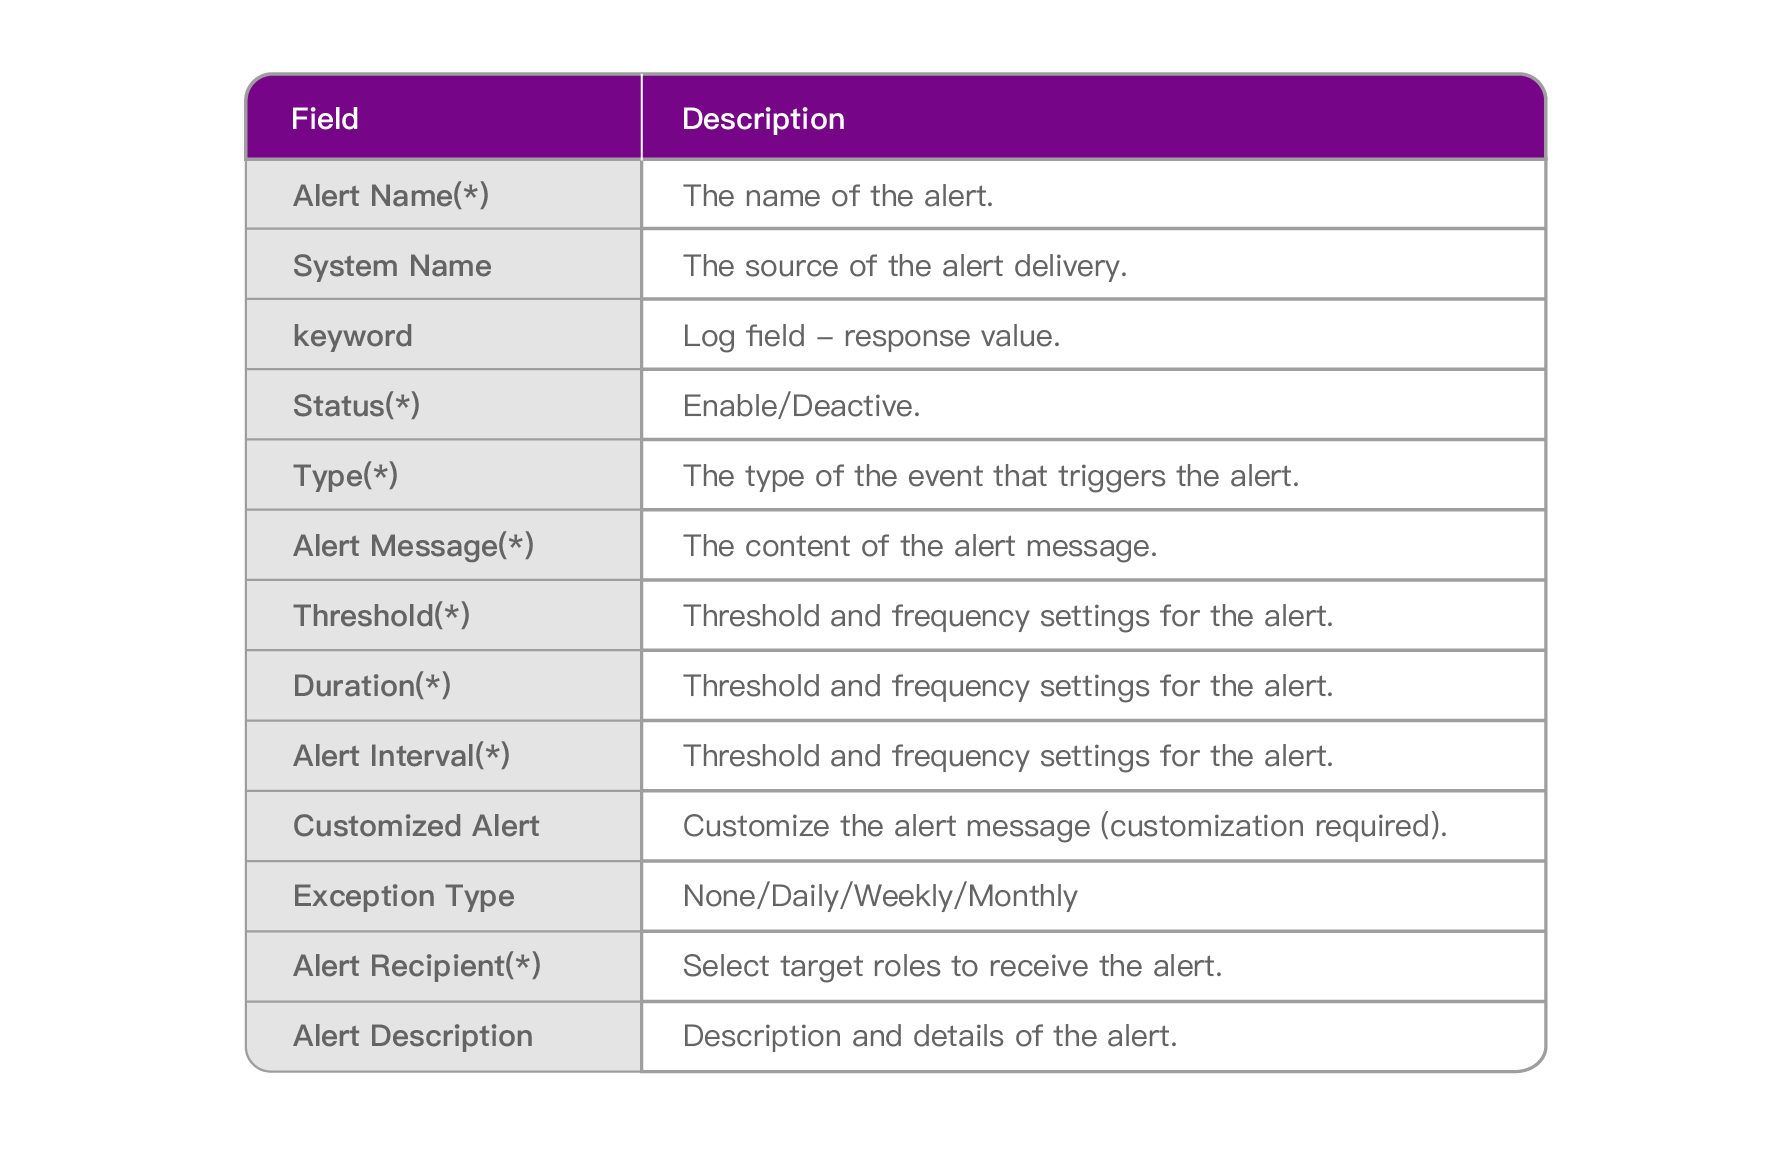
In the following scenarios, you can find out how to set Alerts in digiLogs to help IT turn from passive to active in order to find and deal with the problems immediately when an anomaly occurs so that the issue of passive notification can be eradicated.
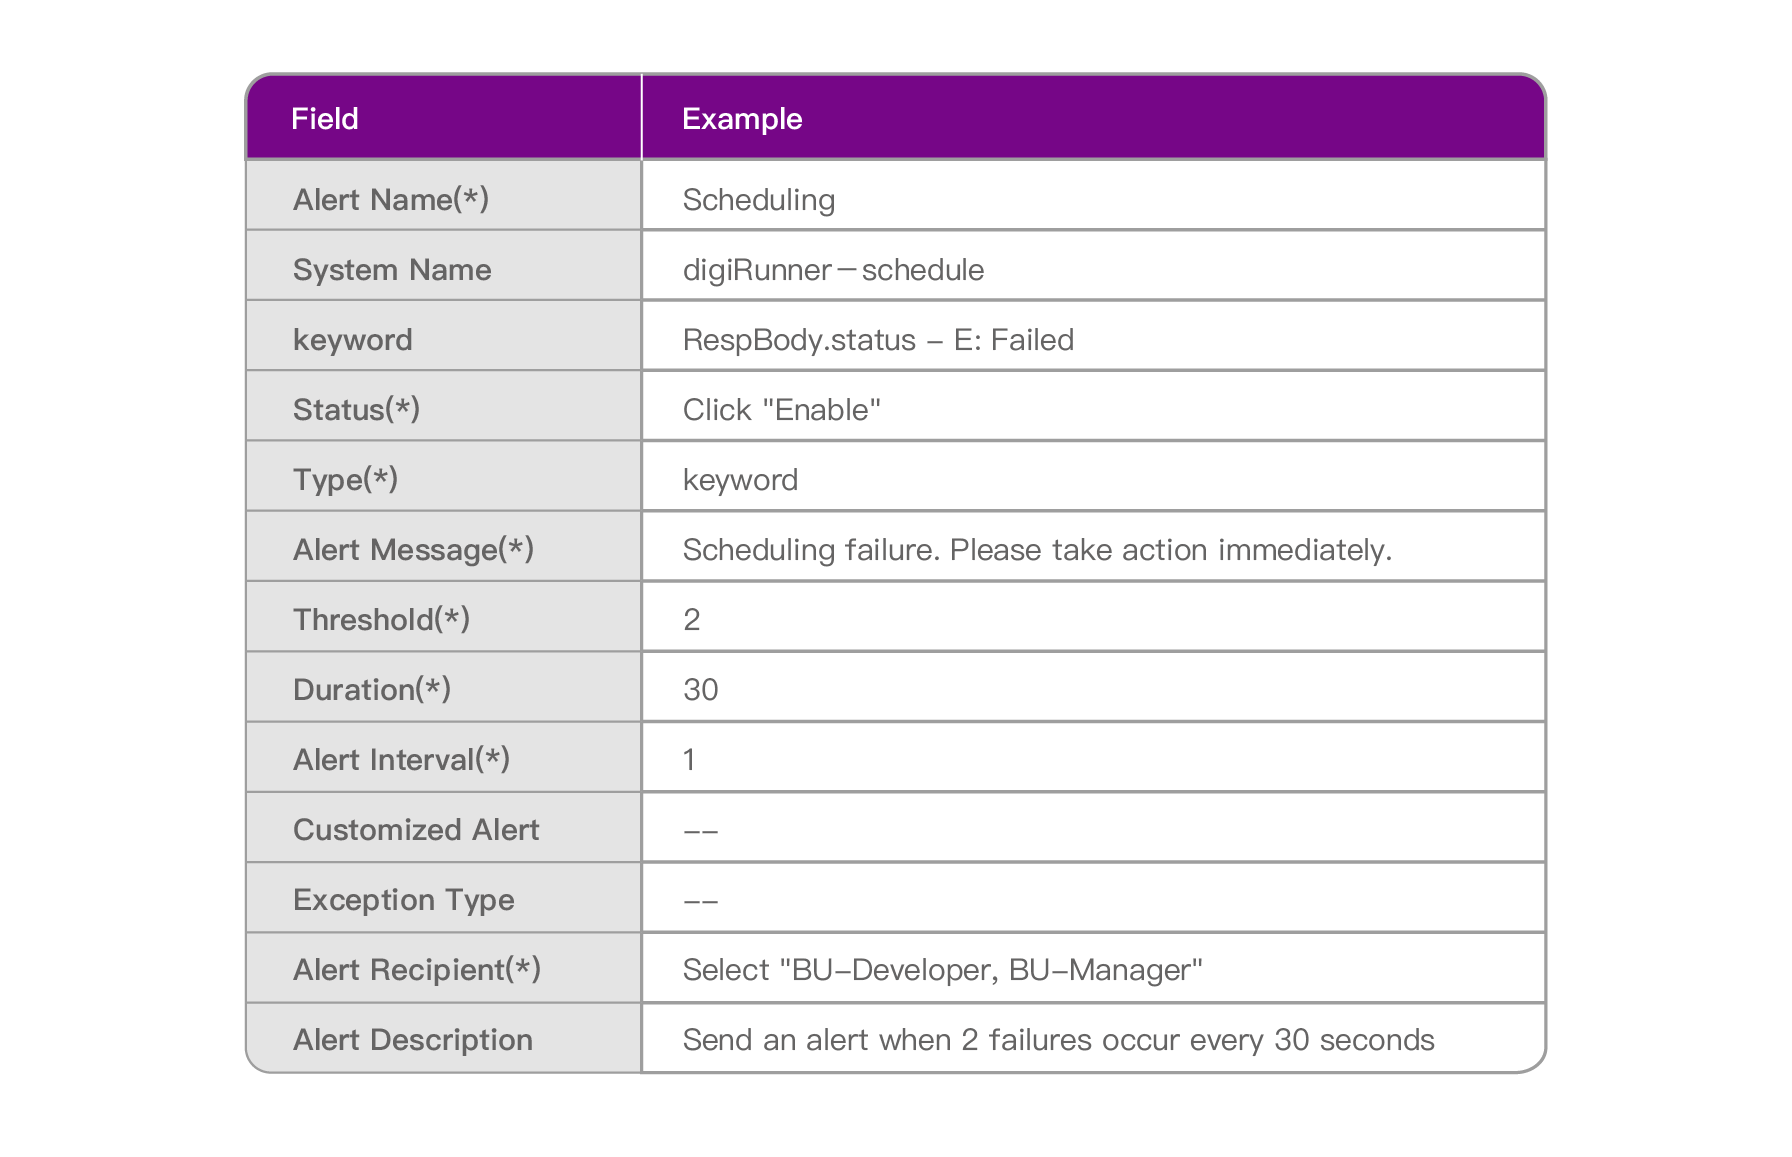
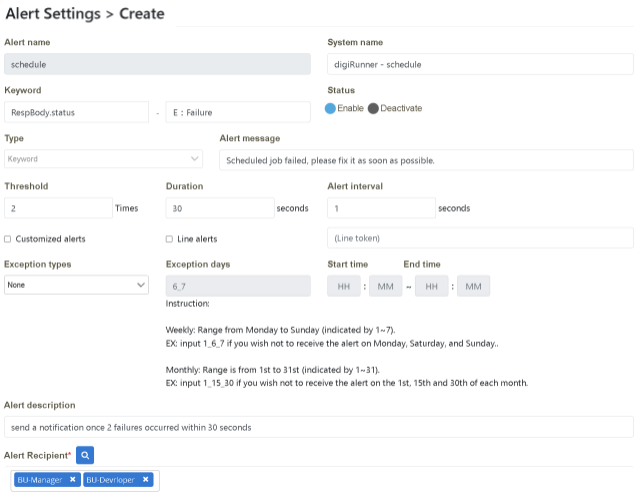
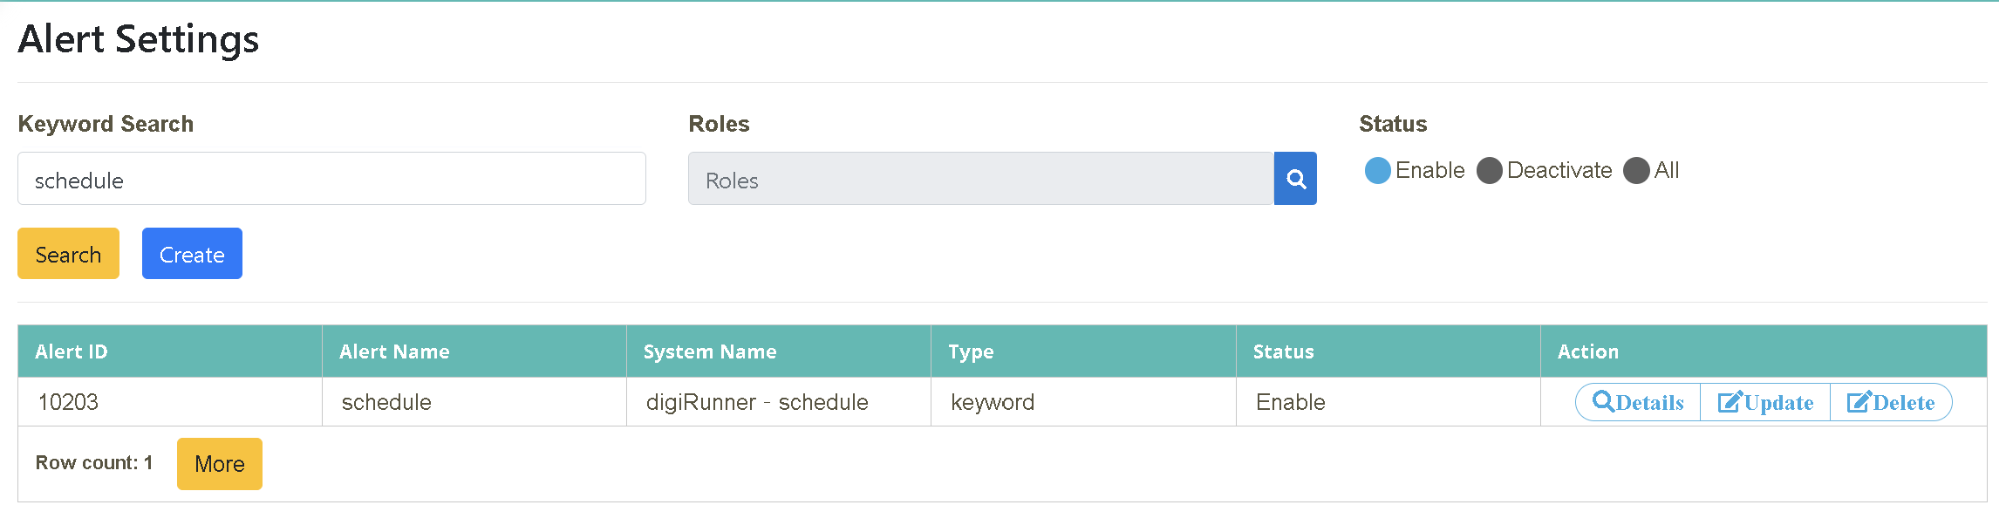
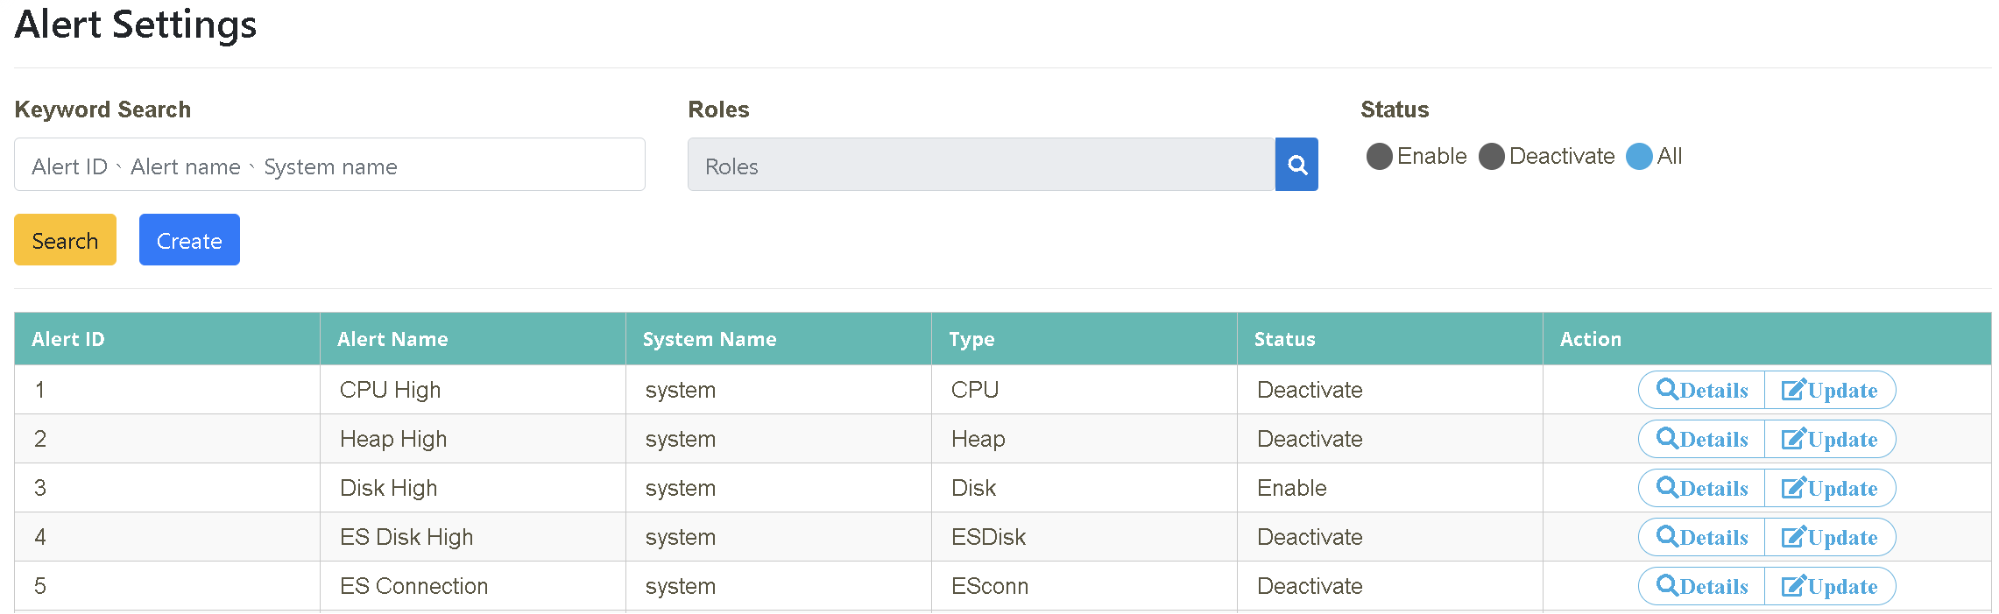
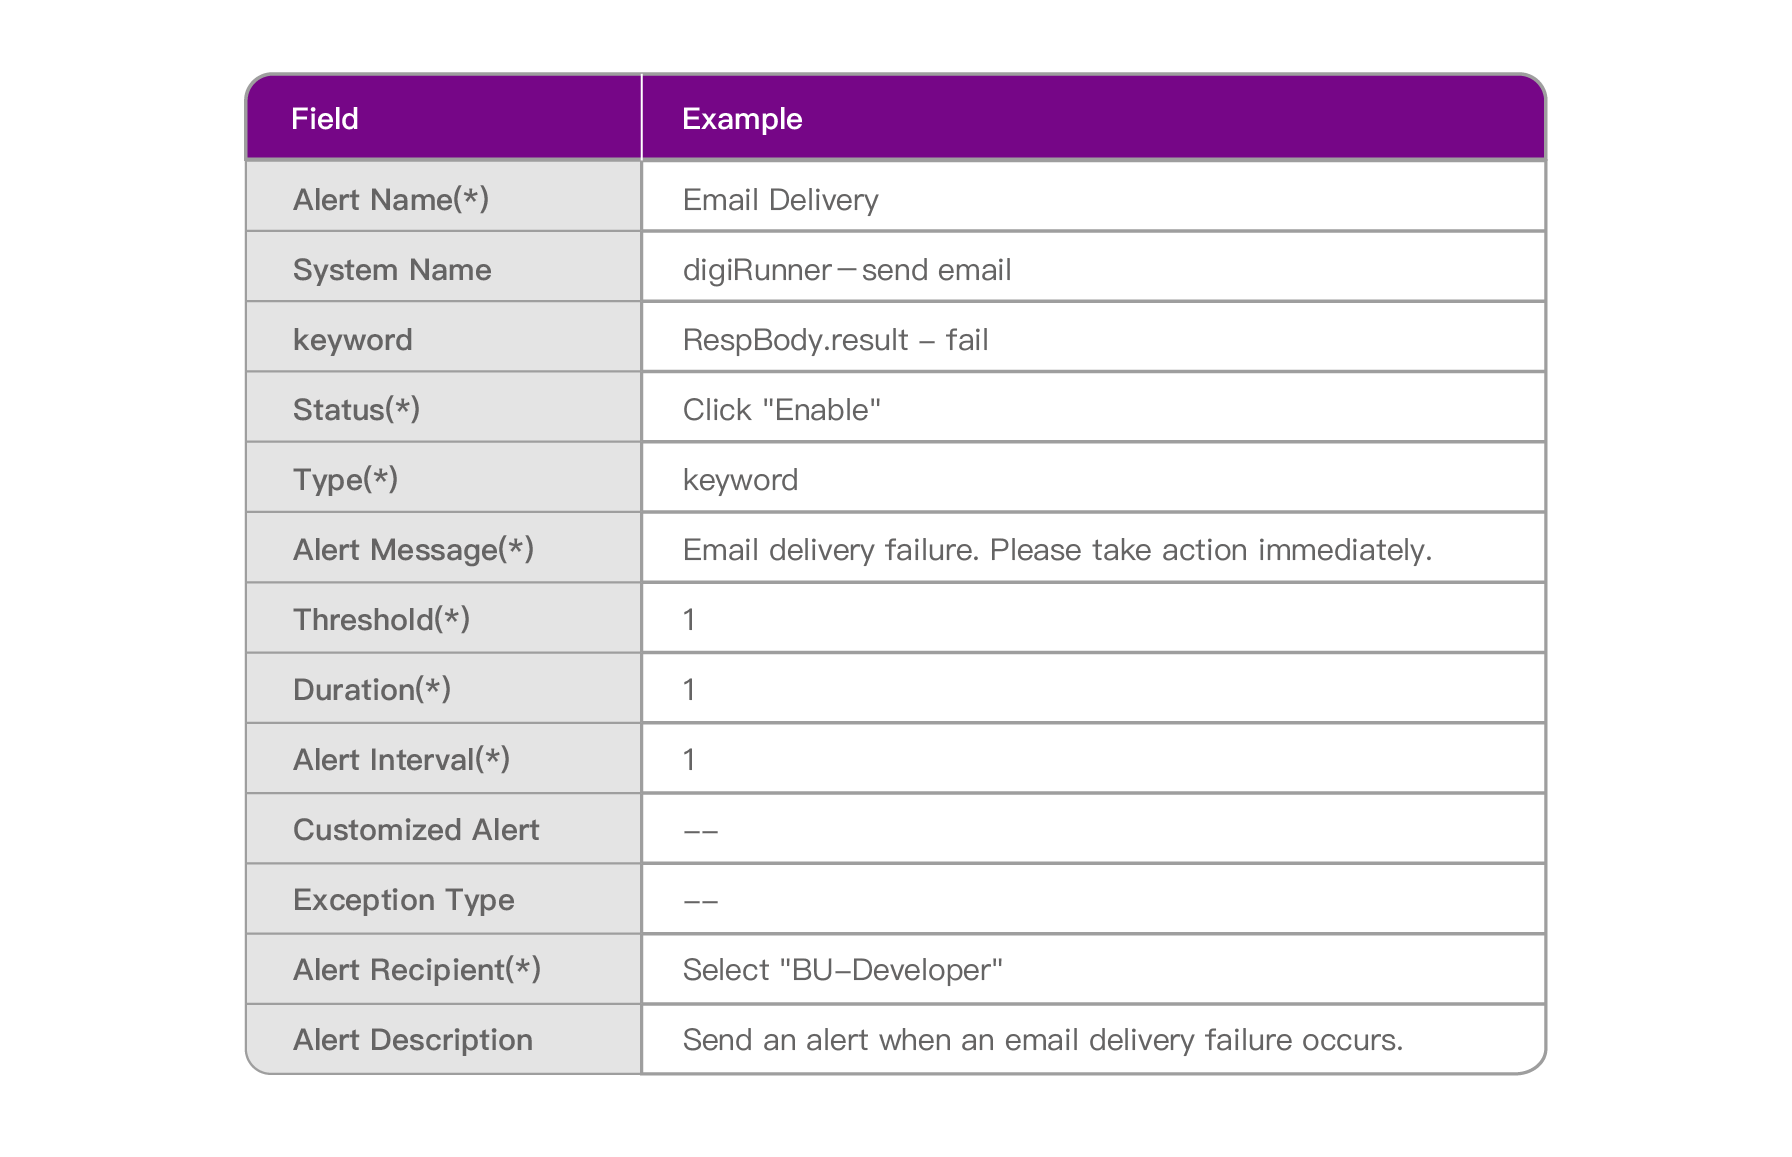
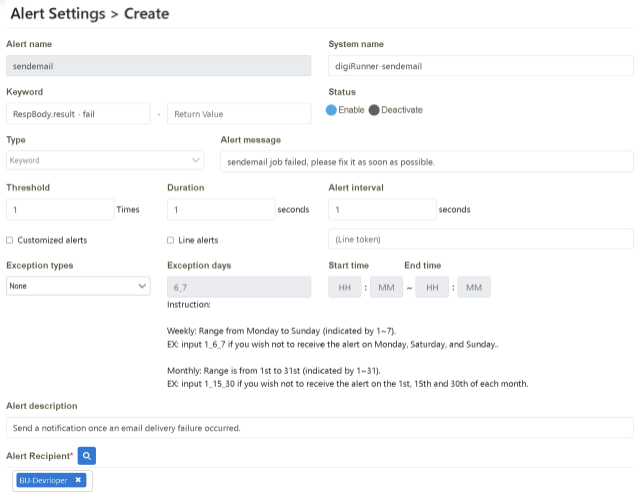
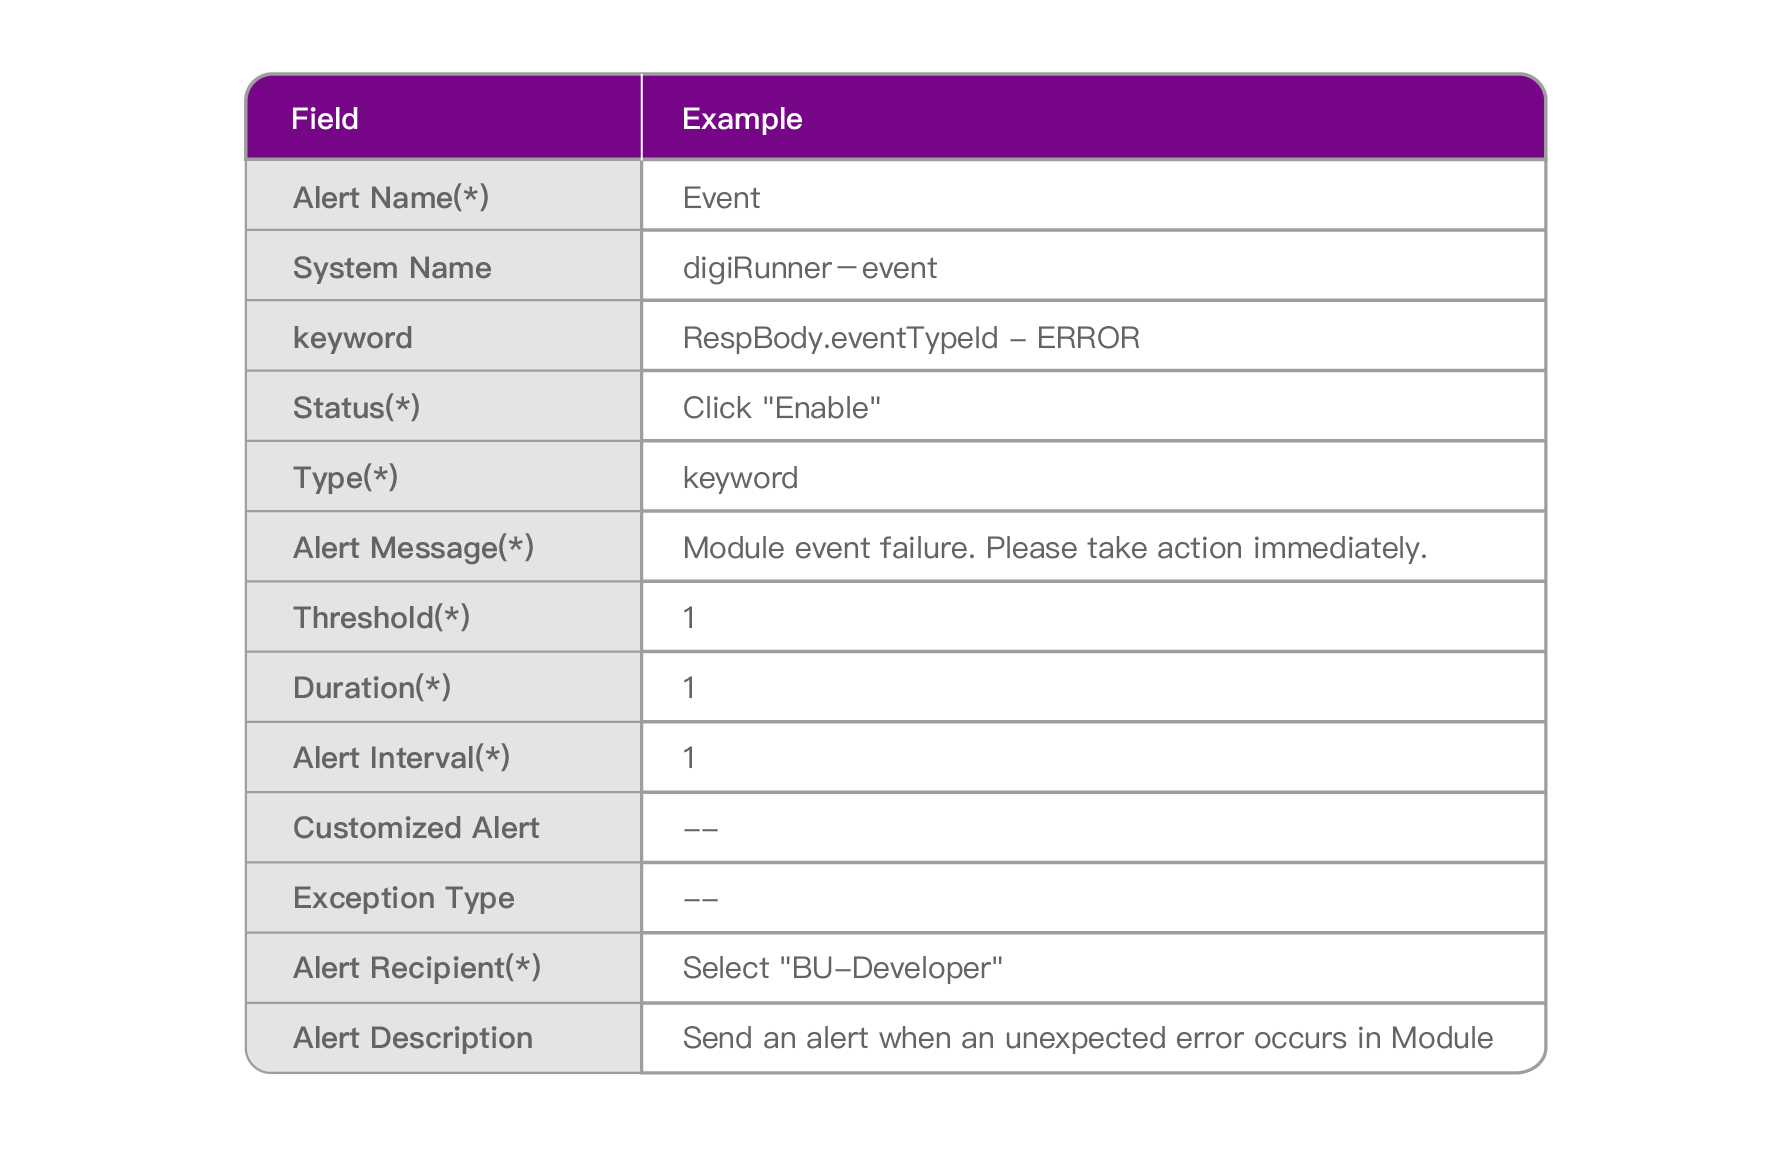
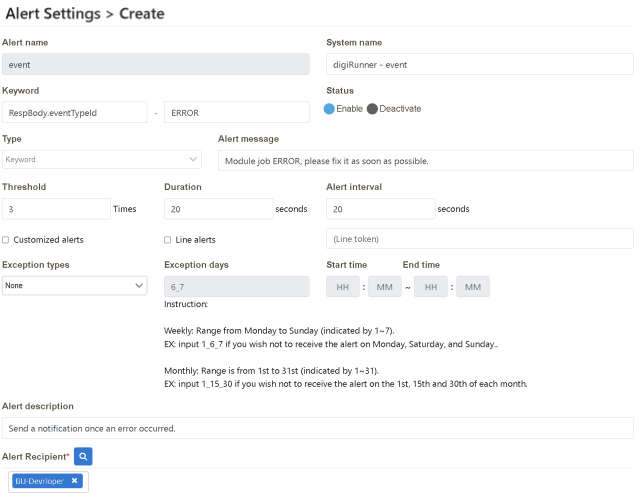
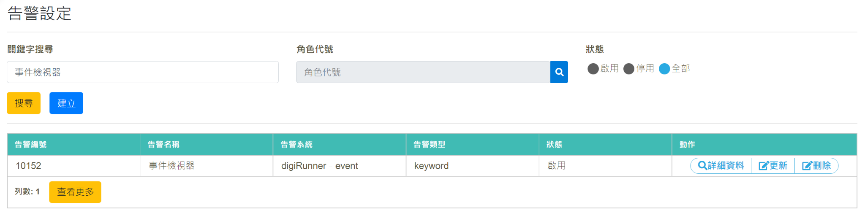
Click on “Monitoring Management” > “Alert Settings”. Click “Create”.
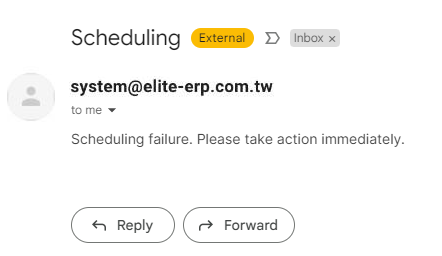
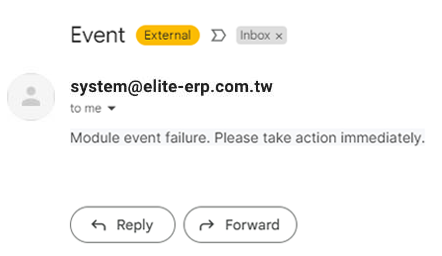
IT developer Tony found that there were recent anomaly events in the “Sending Process” resulting in failing to send mails. To avoid the reoccurrence of similar issues, he decided to ask the Log strategy team to include it on the list of alert notifications spontaneously in order to monitor the situation.
Scenario Description: When the event viewer receives “one” “unknown error”, all the group members with Role: BU-Developer will receive an alert notification.
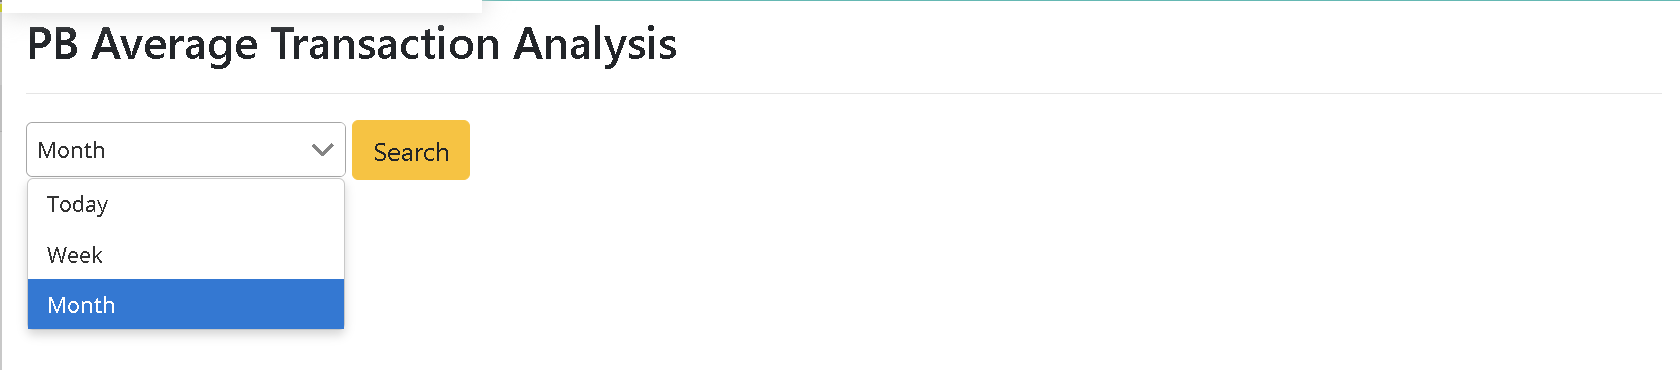
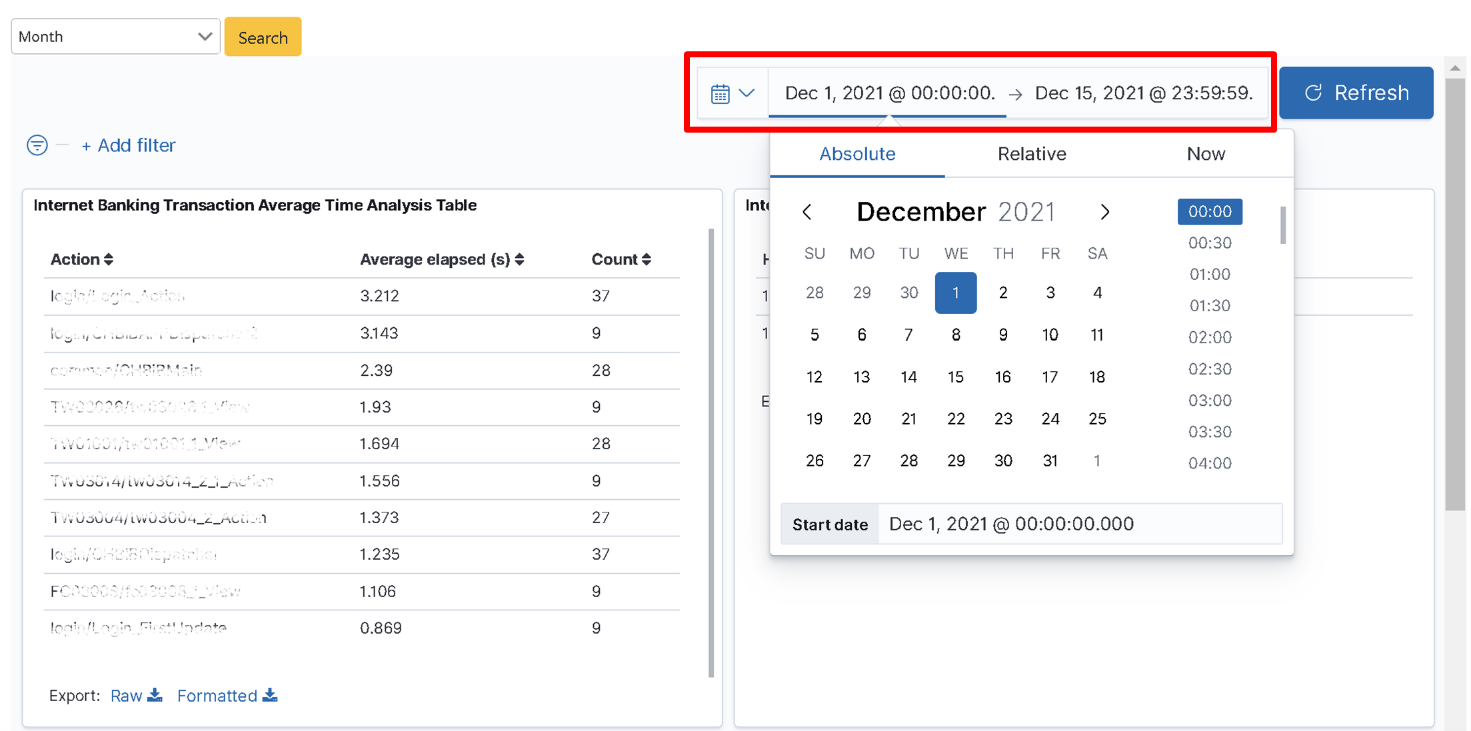
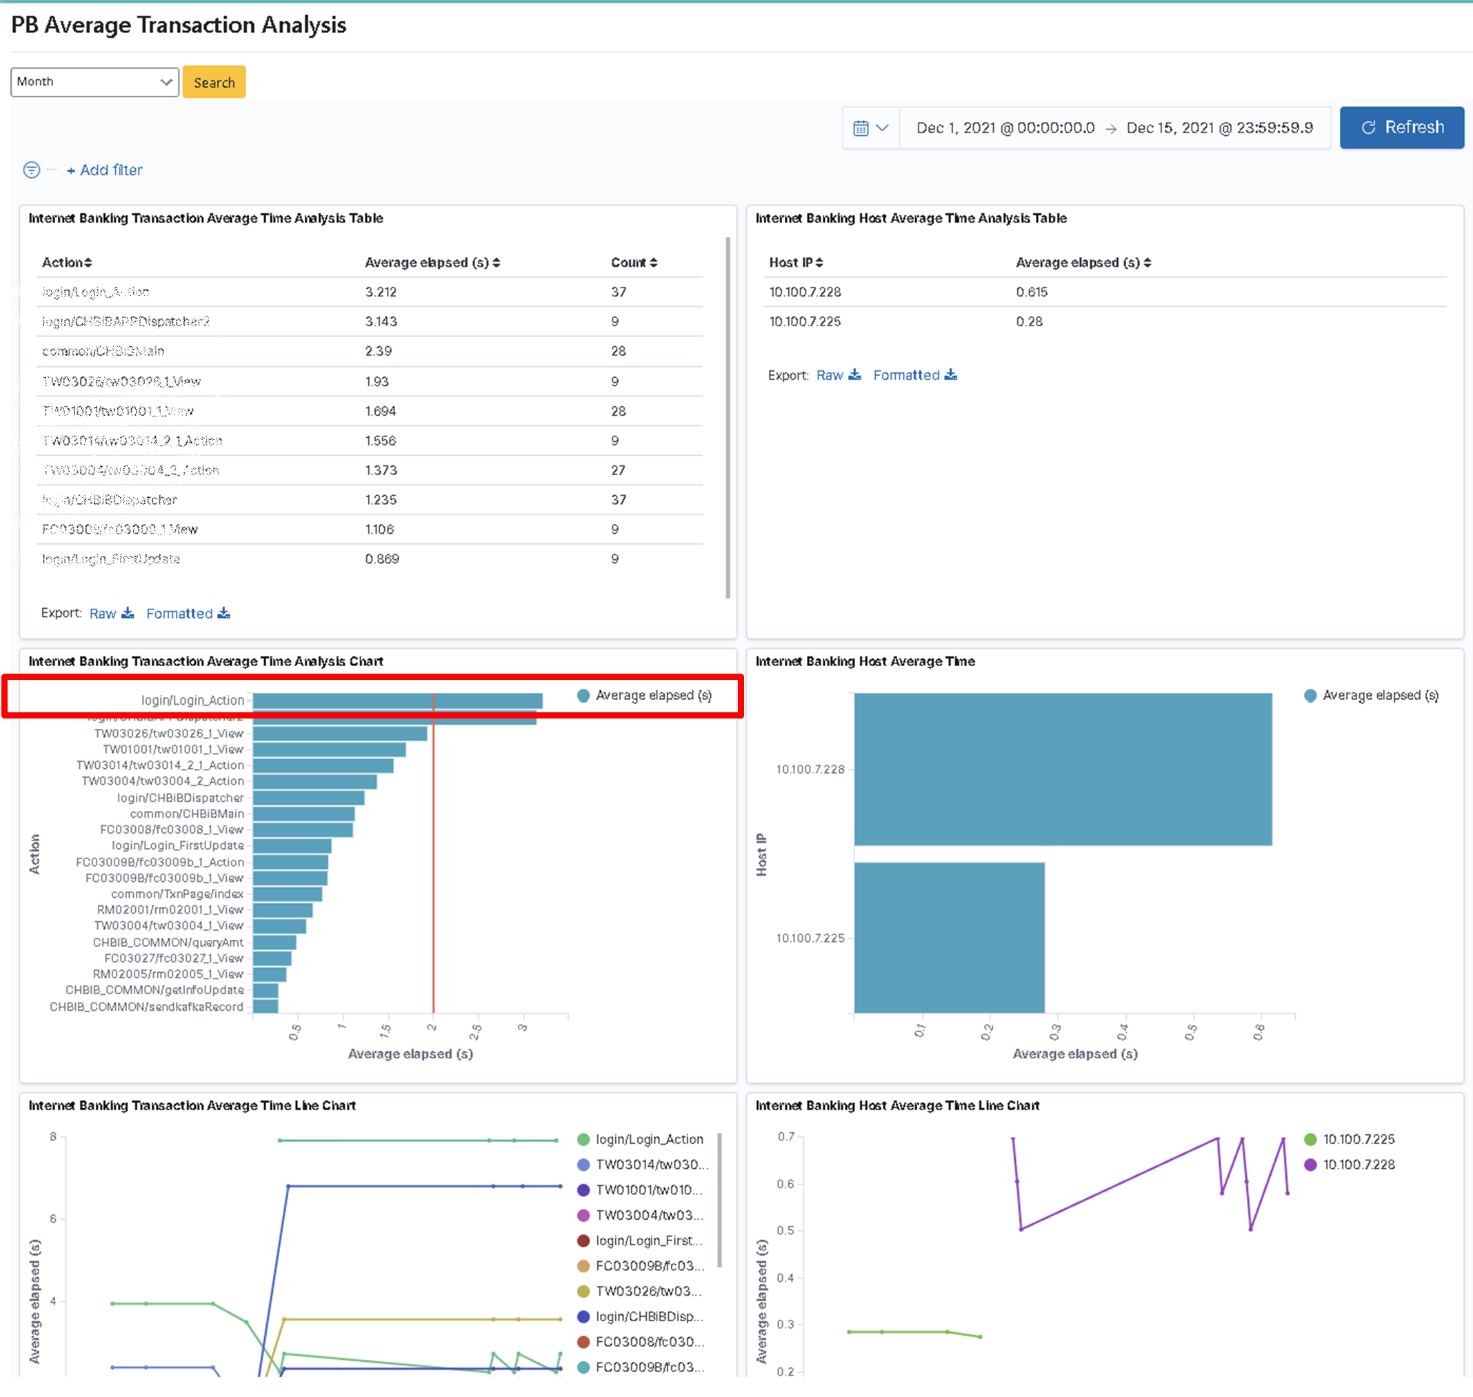
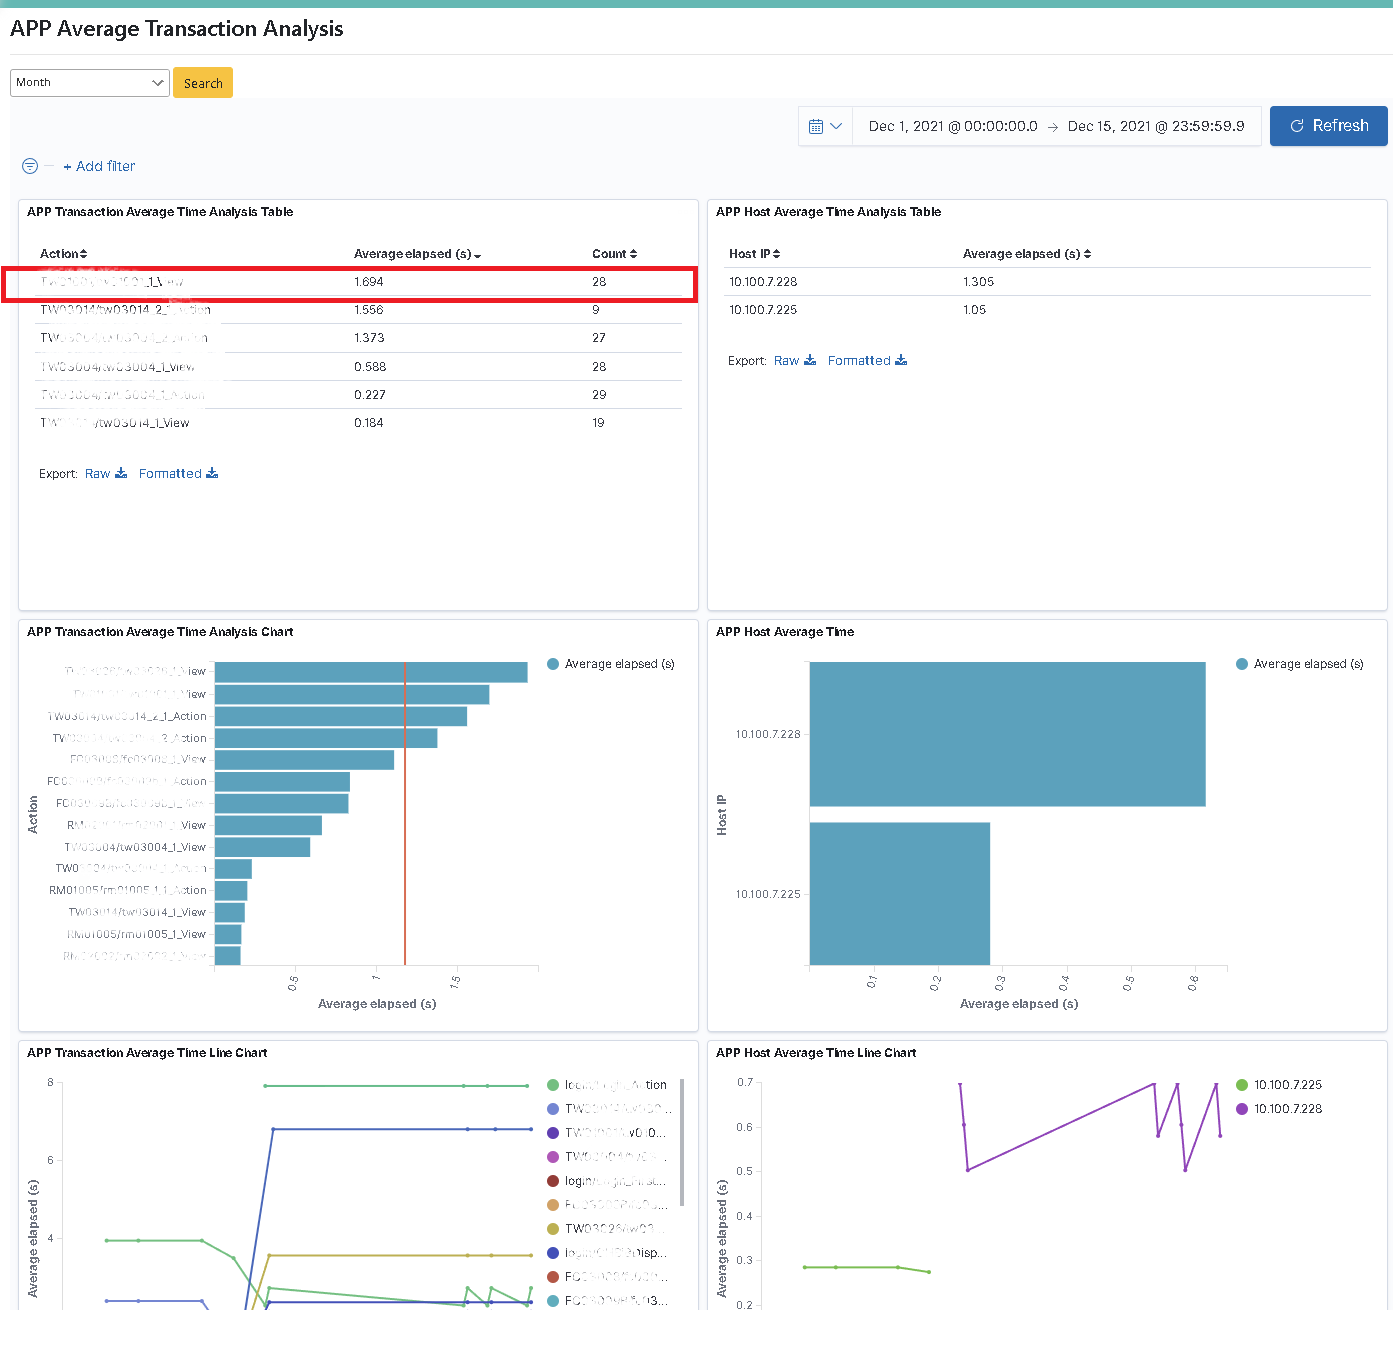
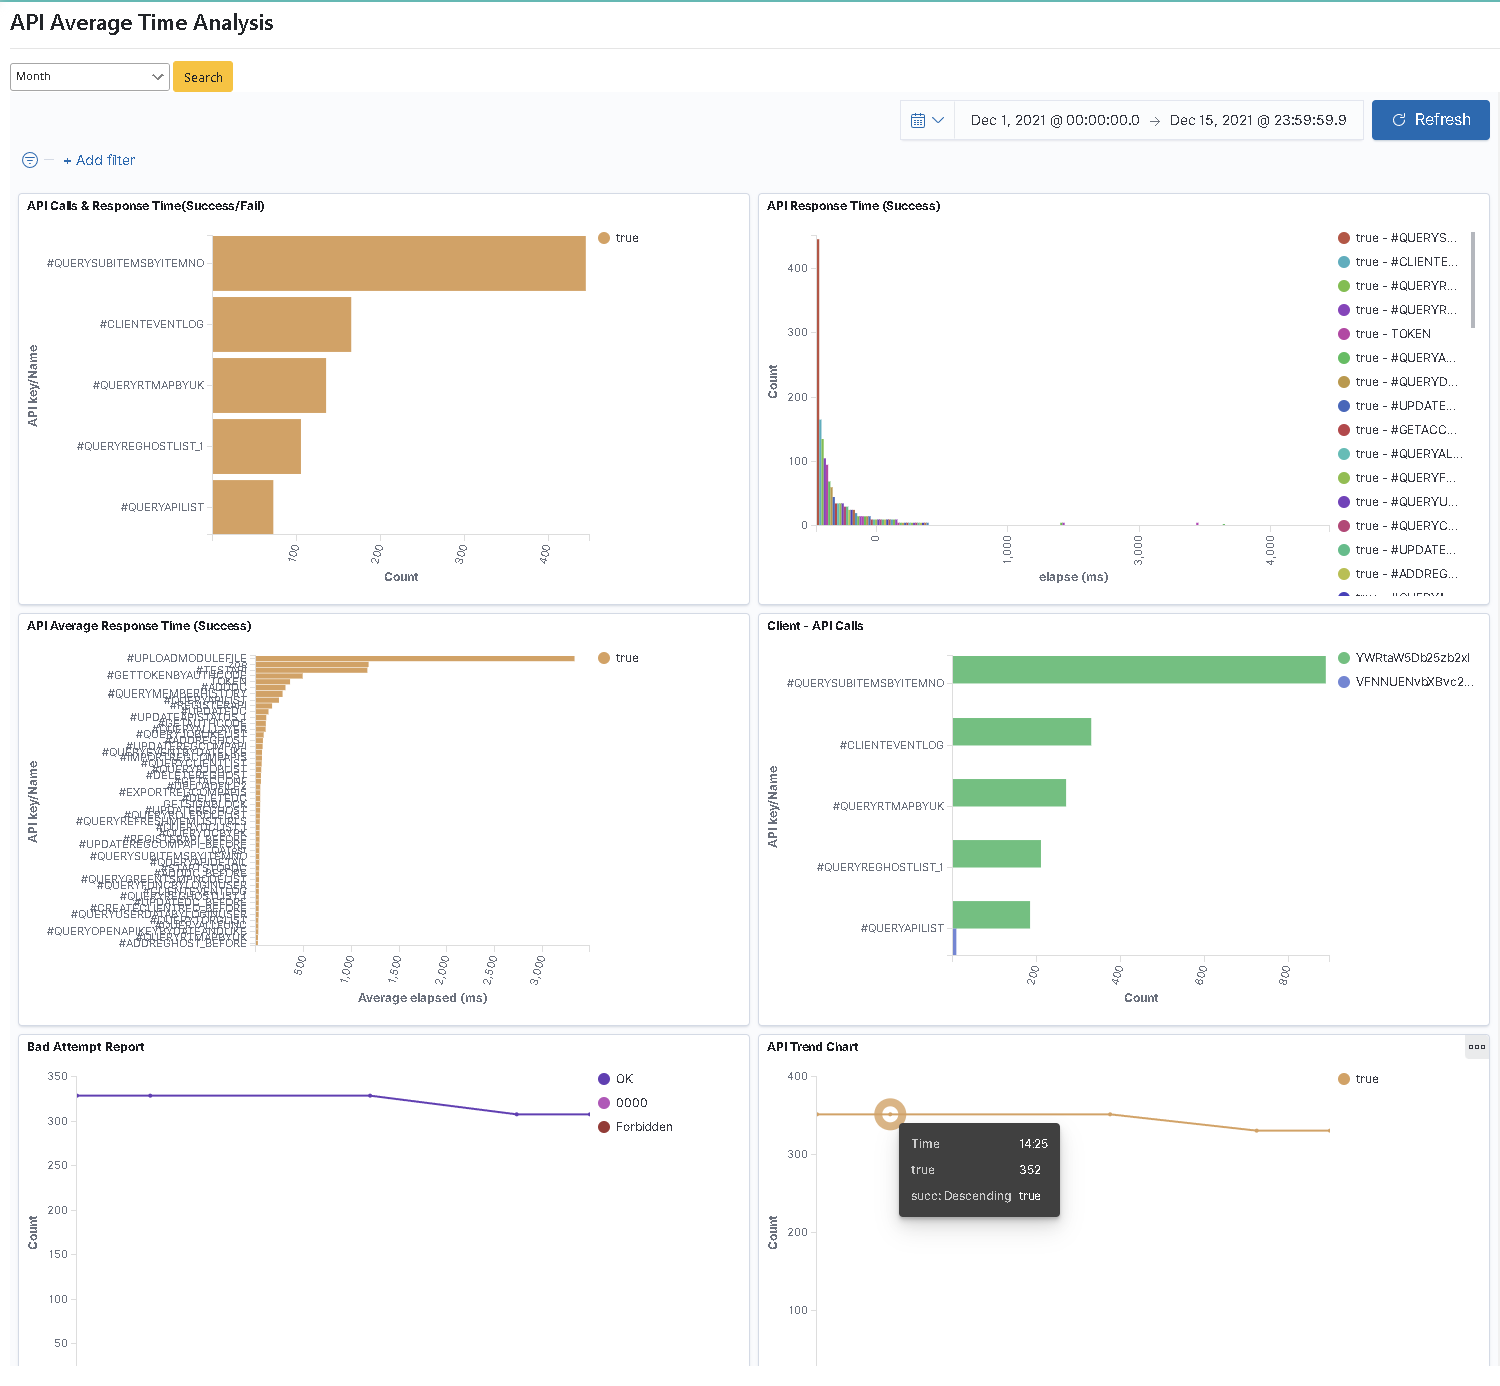
In the past, IT director Bill had to report the operation and usage status of each system to manager Wang on a regular basis. The data regarding the operation and usage status are considered key items of concern, especially after the major systems were launched. Due to the constraint of meeting time, Bill hopes to present the content of the report in a clear and easy-to-understand fashion. In addition, he wants to be able to monitor the indexes on the report in real-time to see if there are problems such as overtime, anomalies that need to be improved. In this regard, digiLogs provides a service for enterprises to develop customized reports with a graphic representation according to task requirements so that people can understand the information easily and make quick analyses.
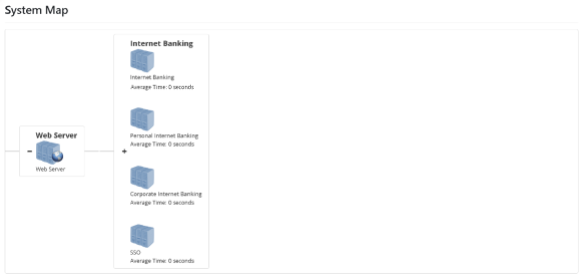
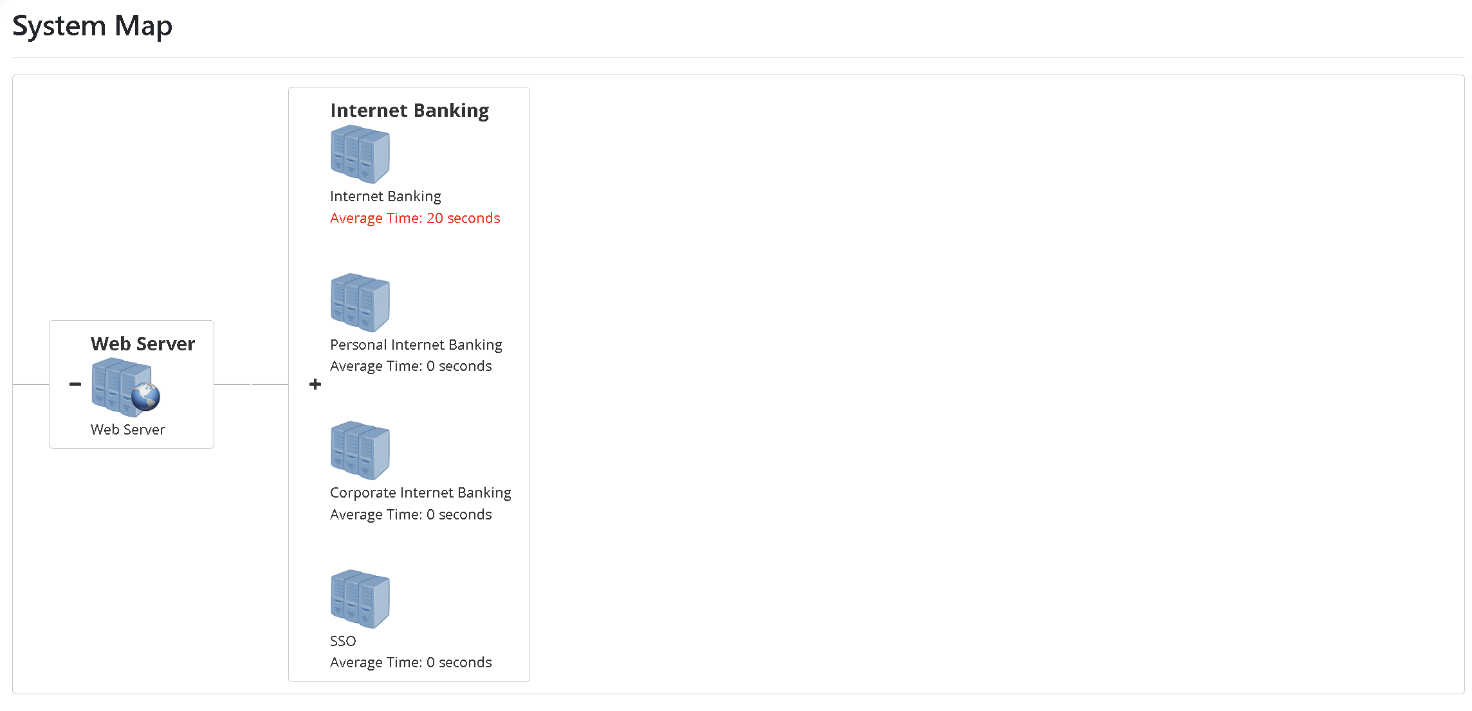
When anomalies occur, the “average time” in the (personal online banking) system will appear “in red”.
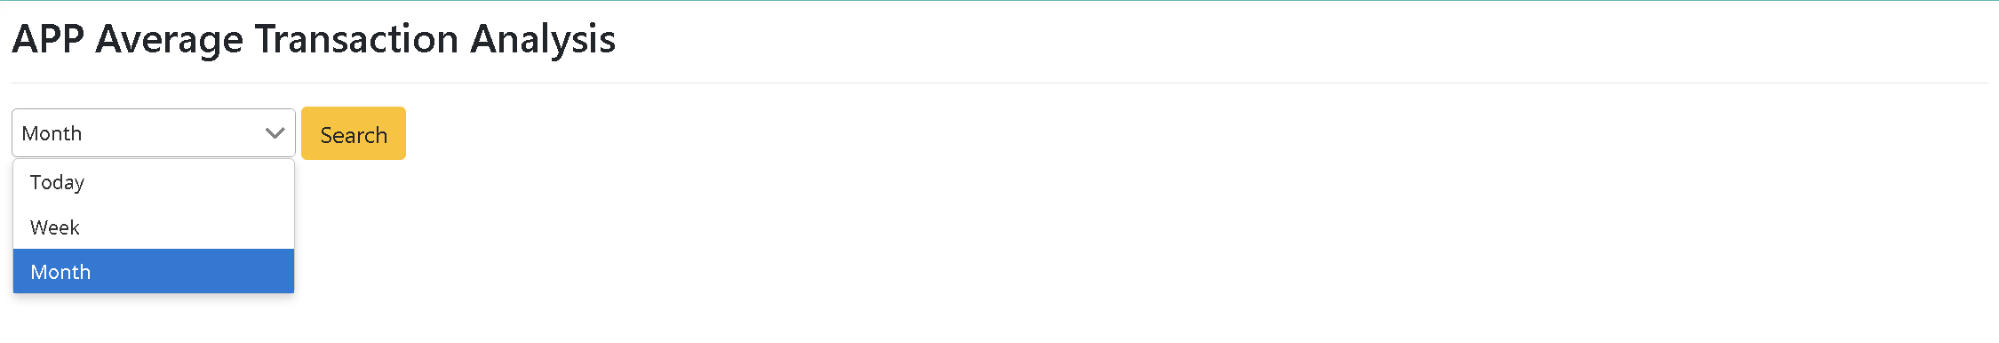
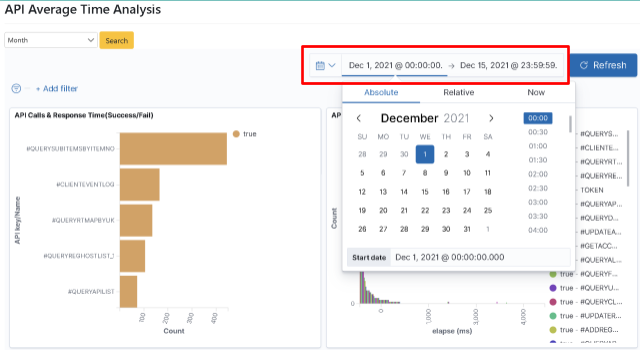
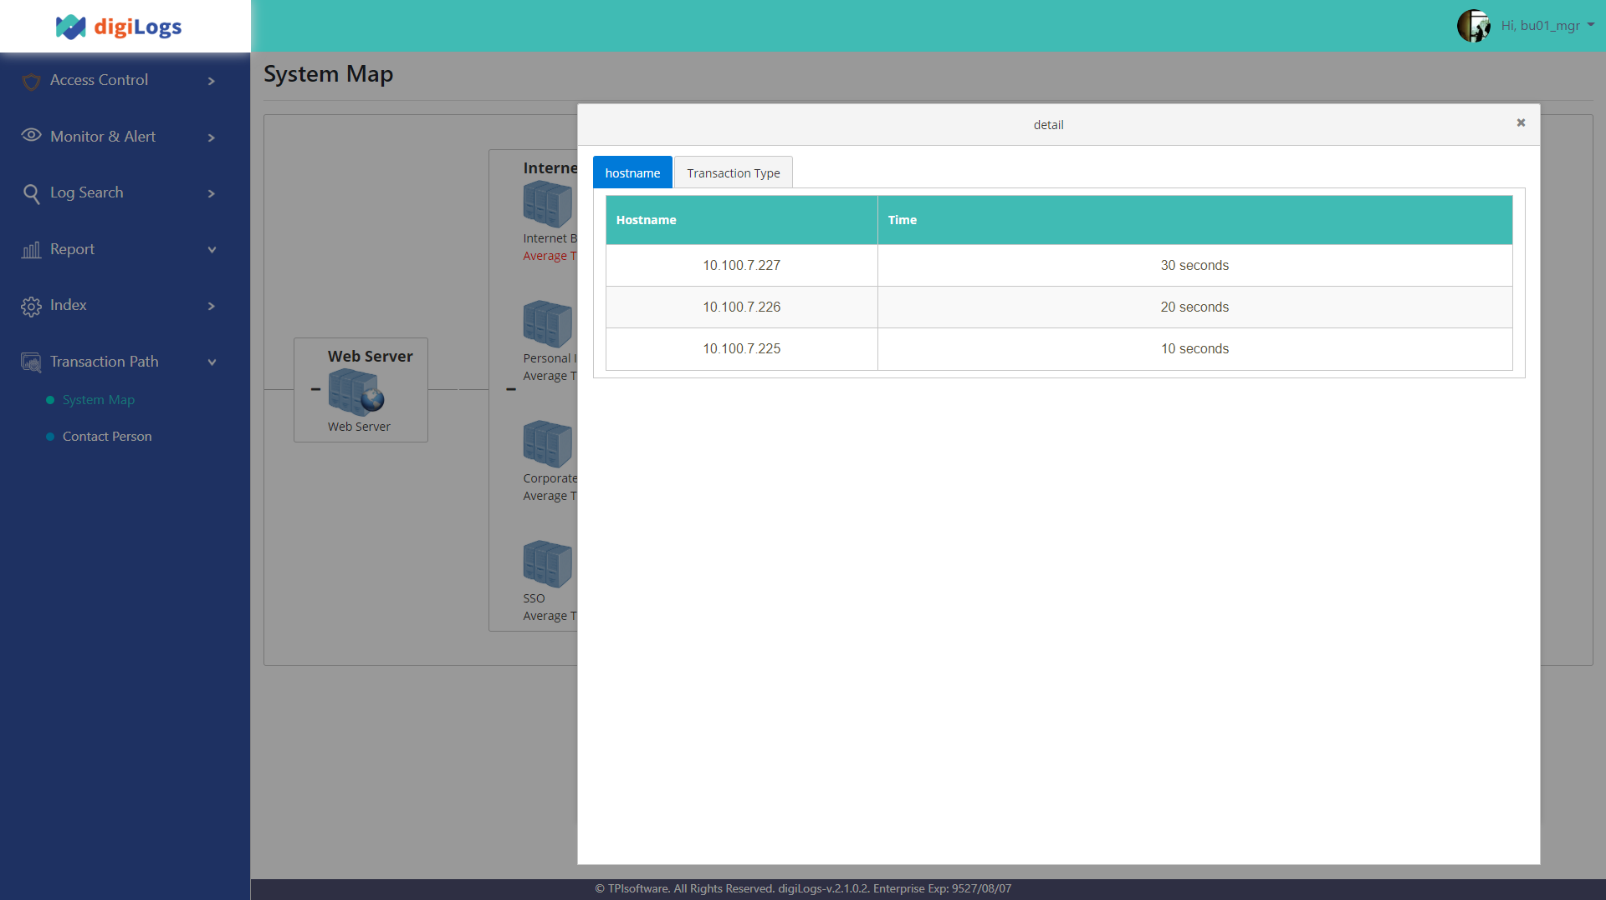
One day, an anomaly occurred in the “centralized API system”.
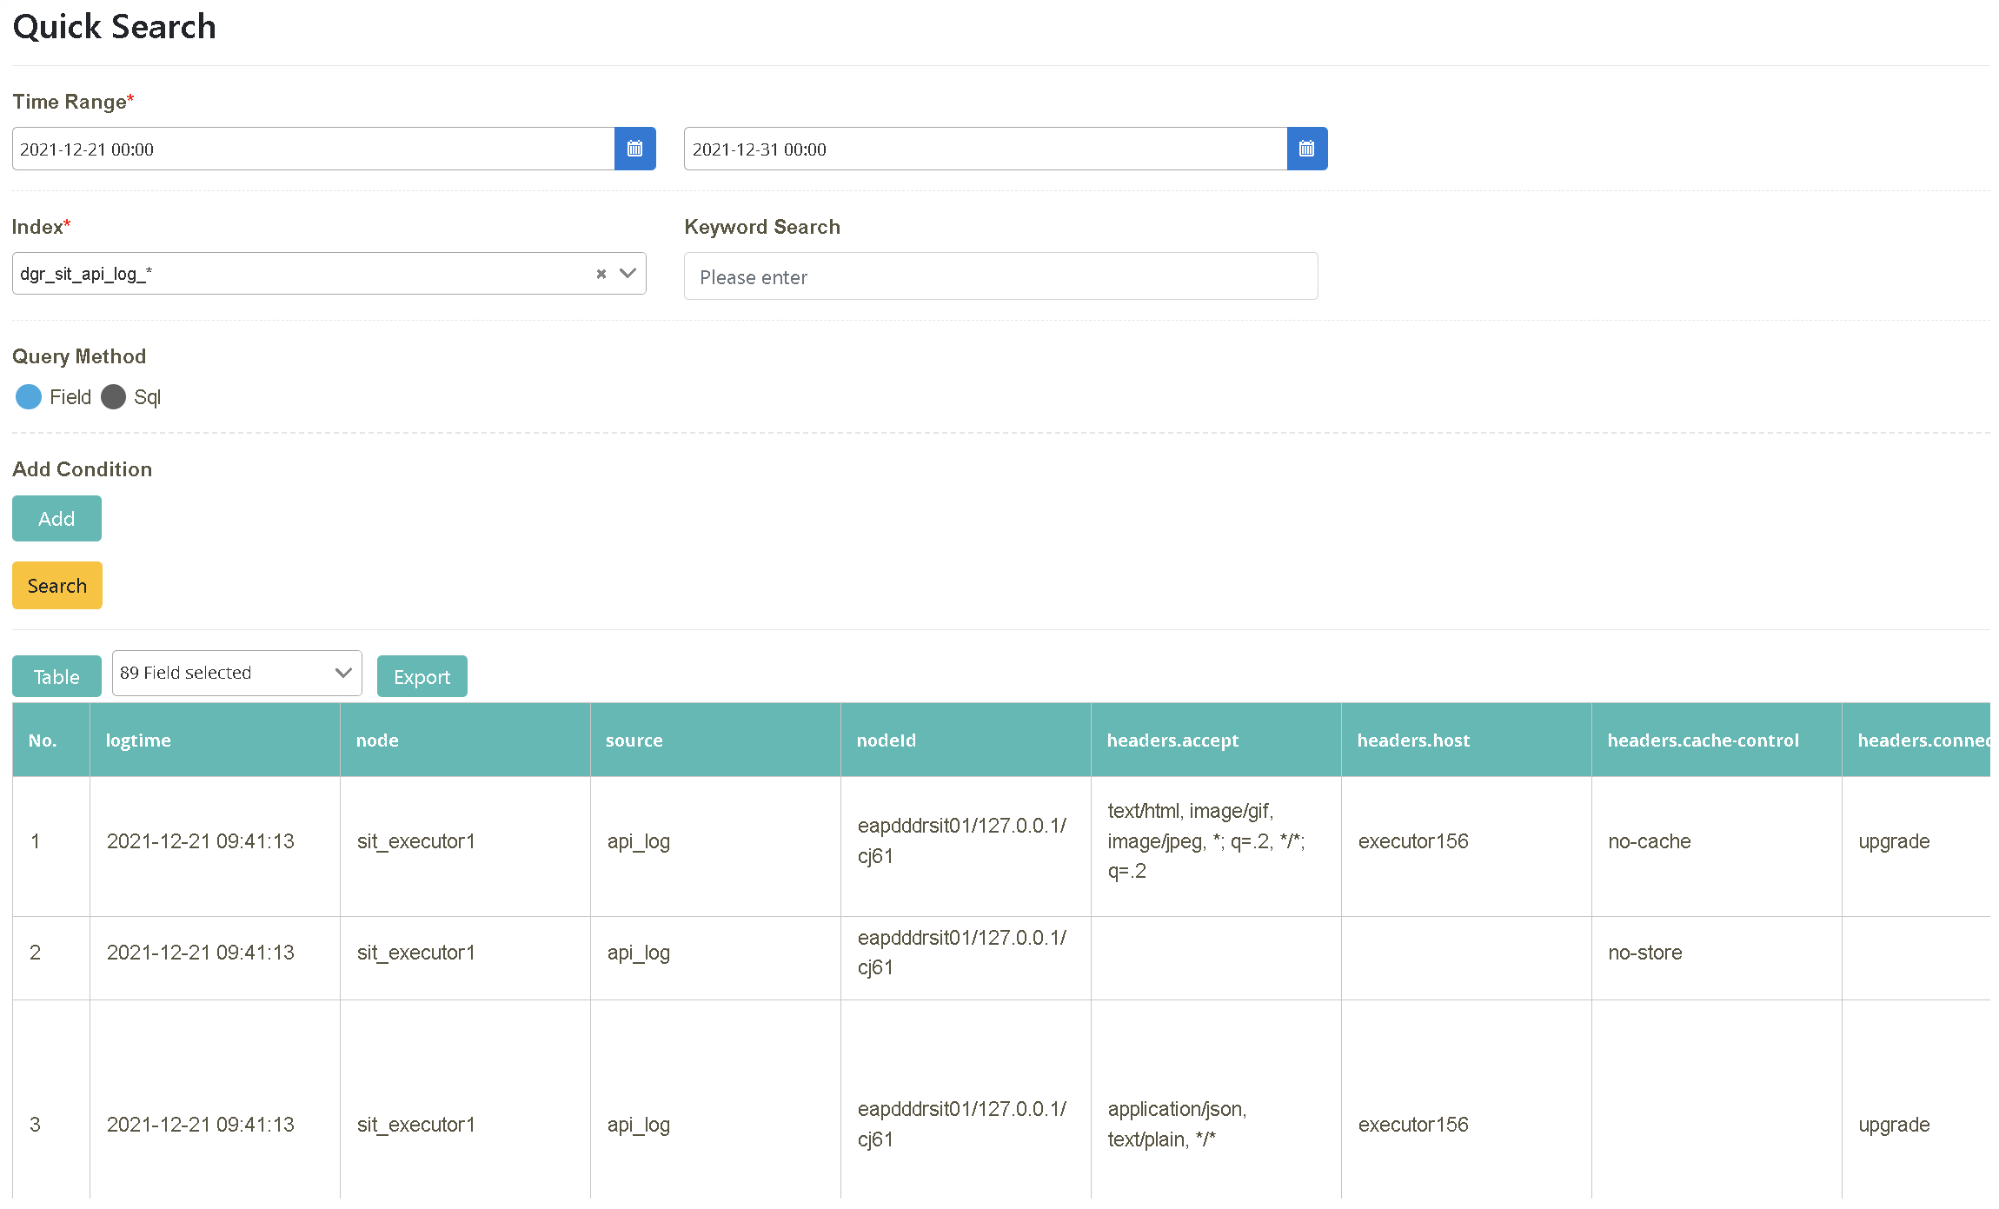
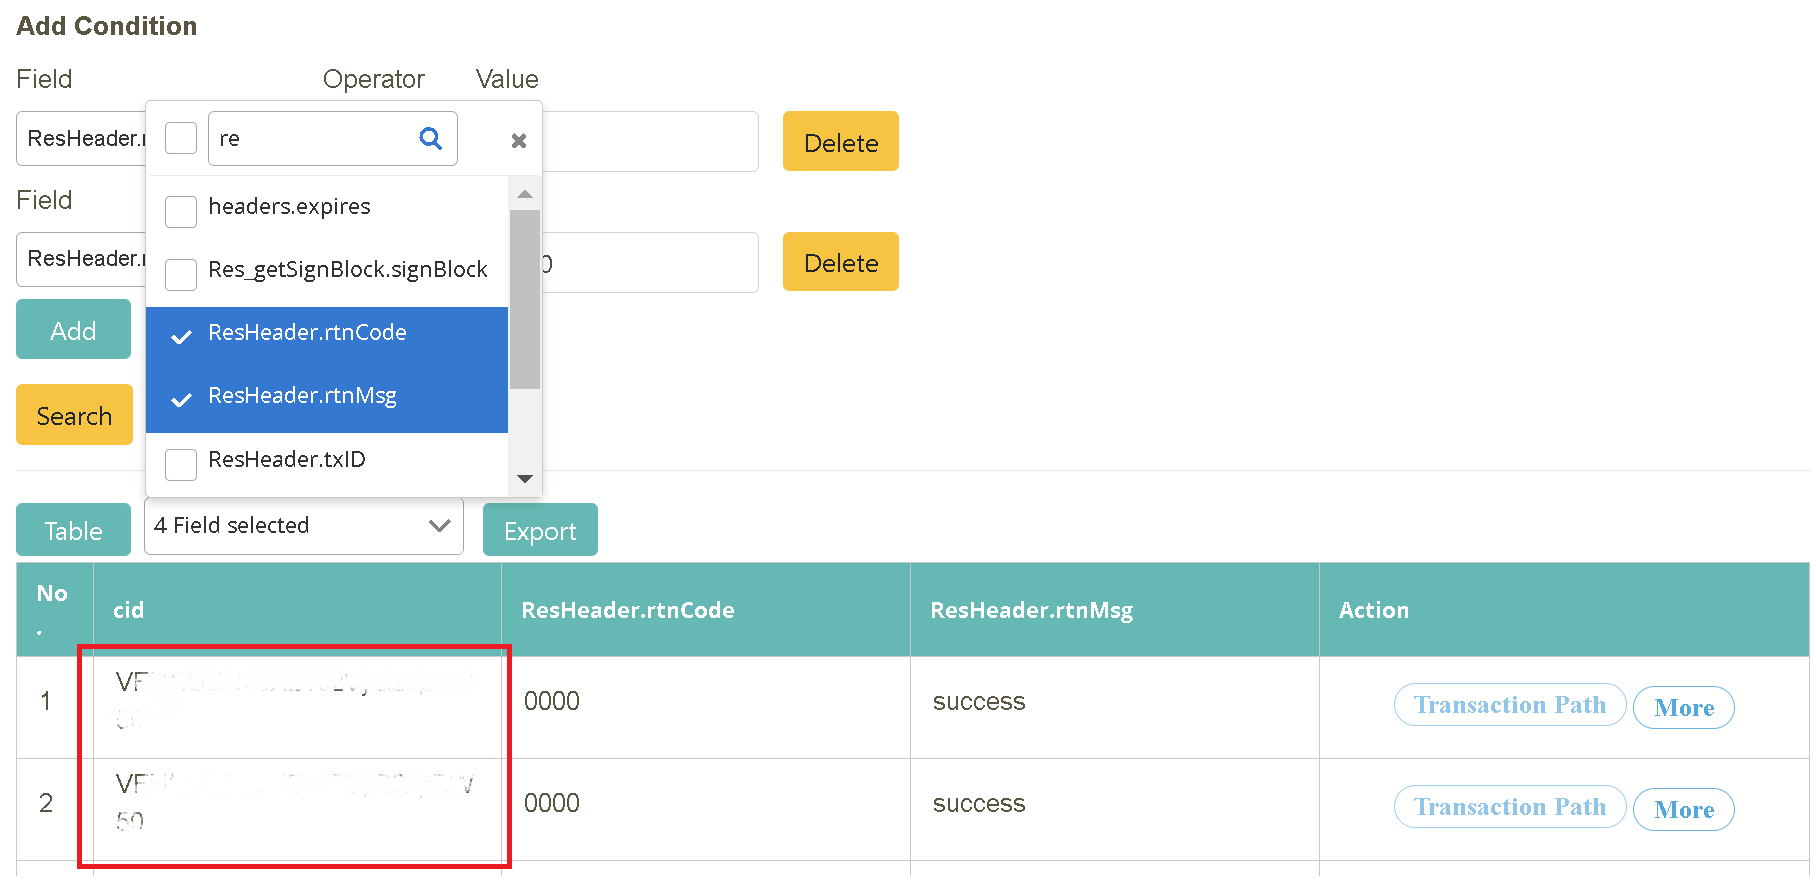
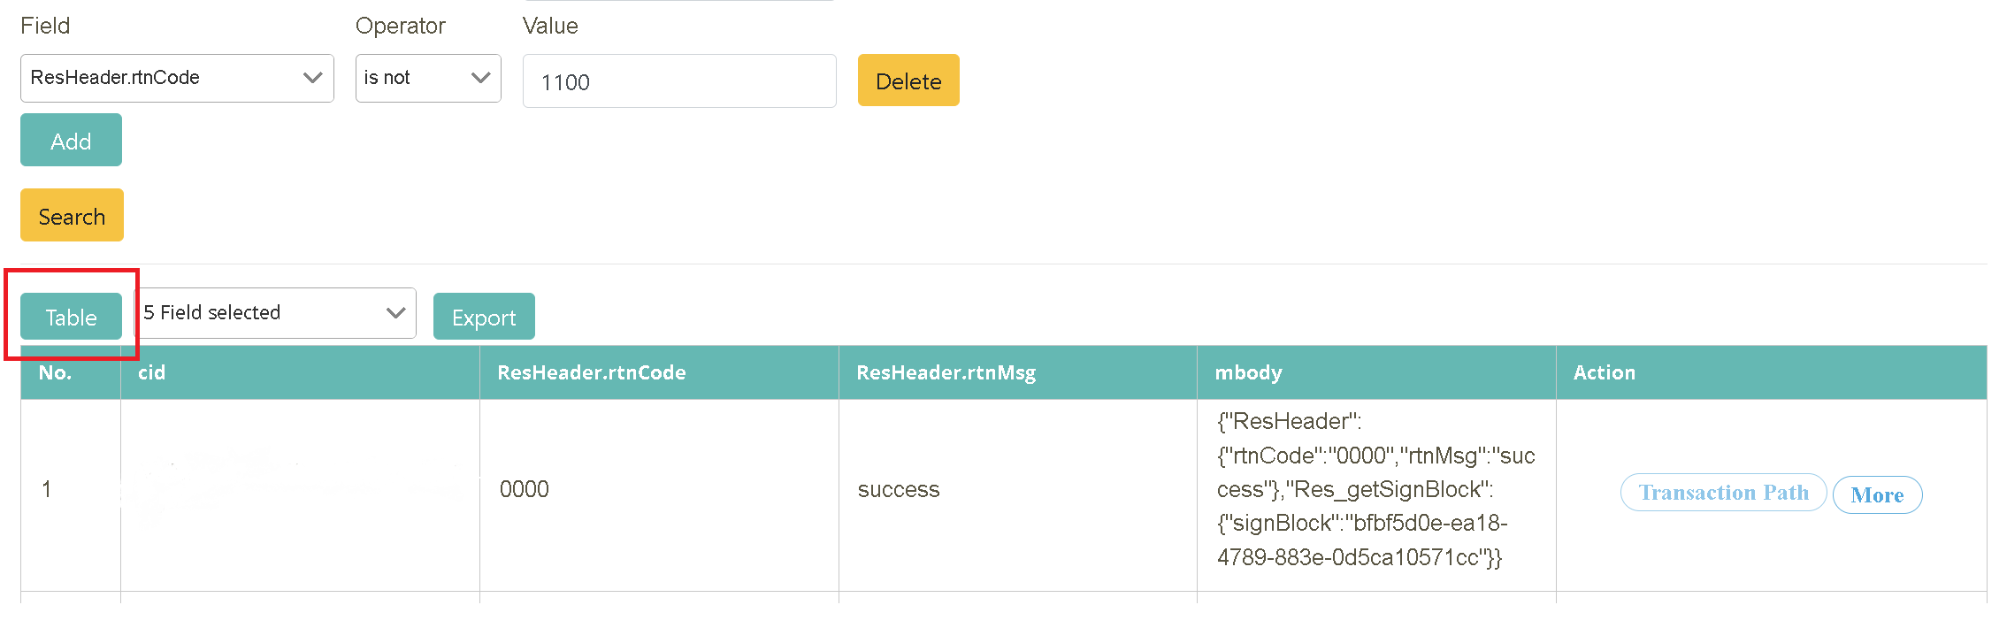
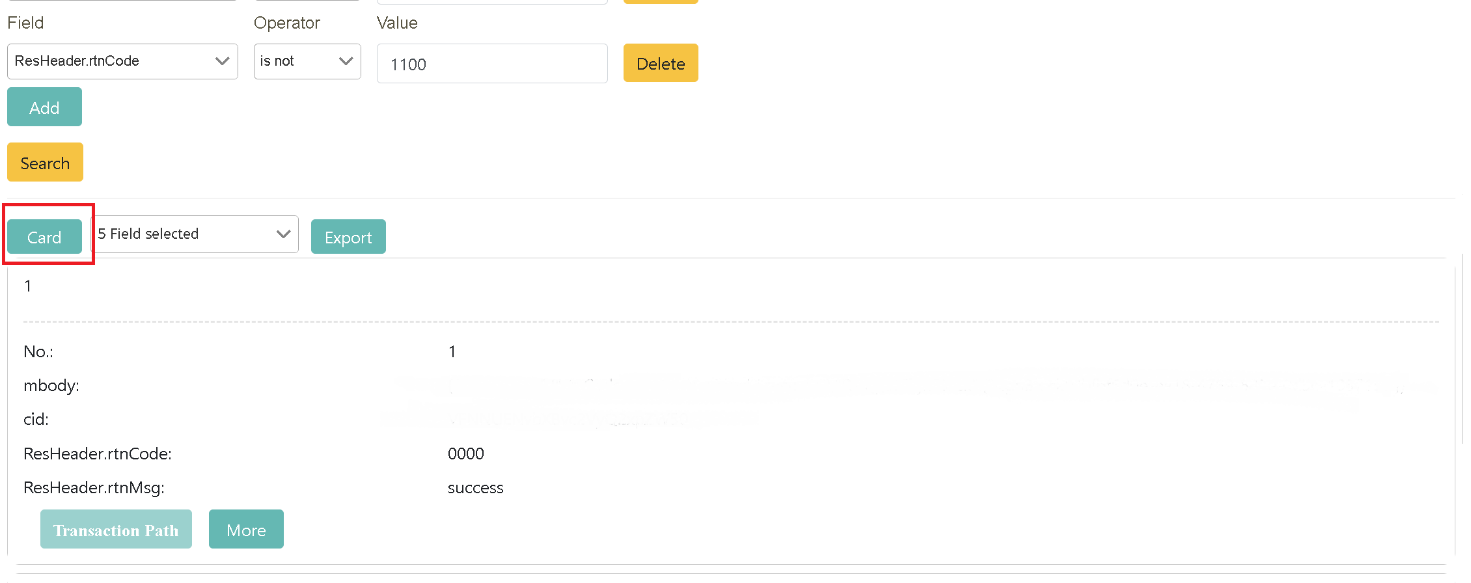
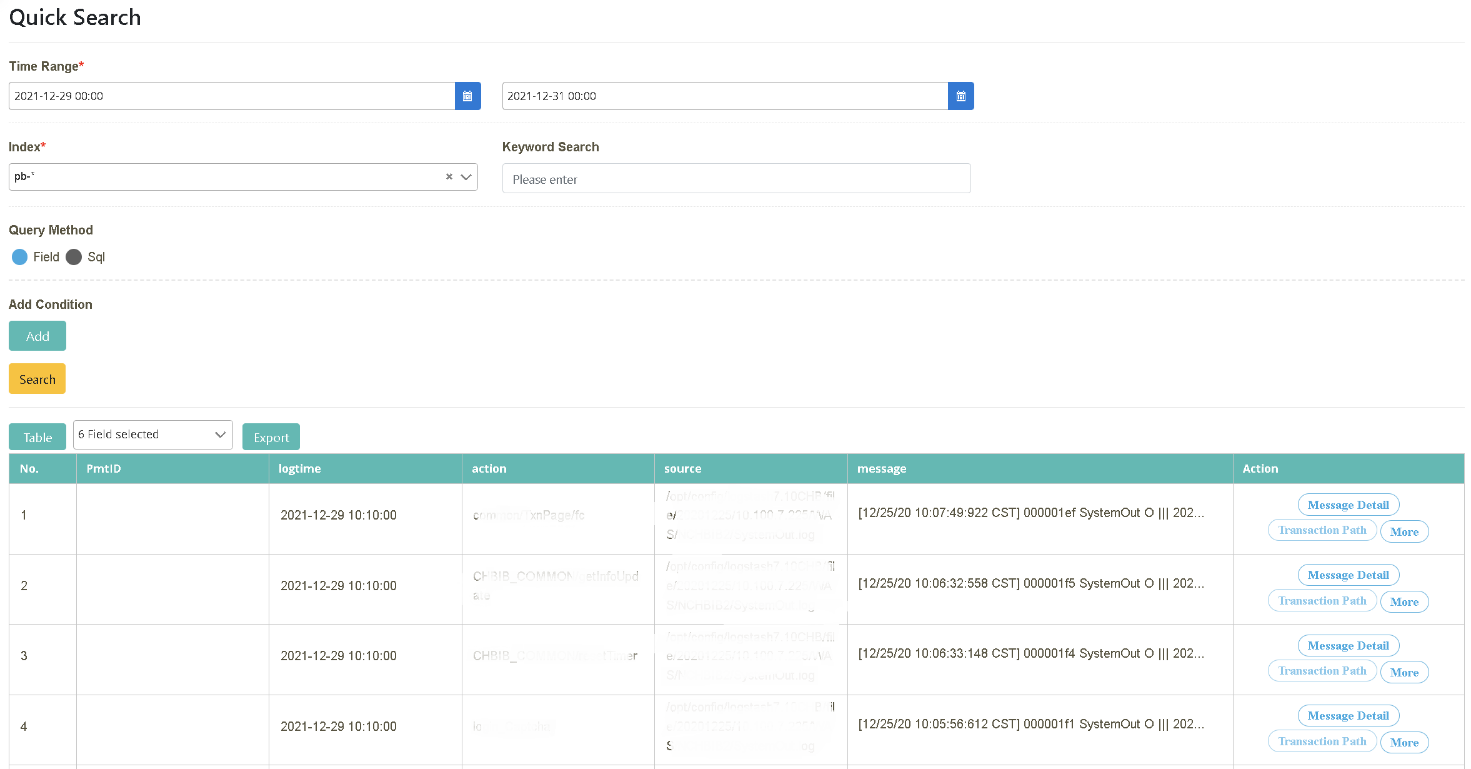
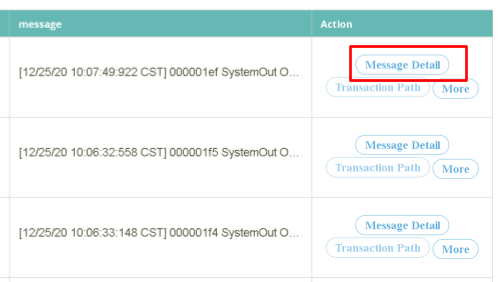
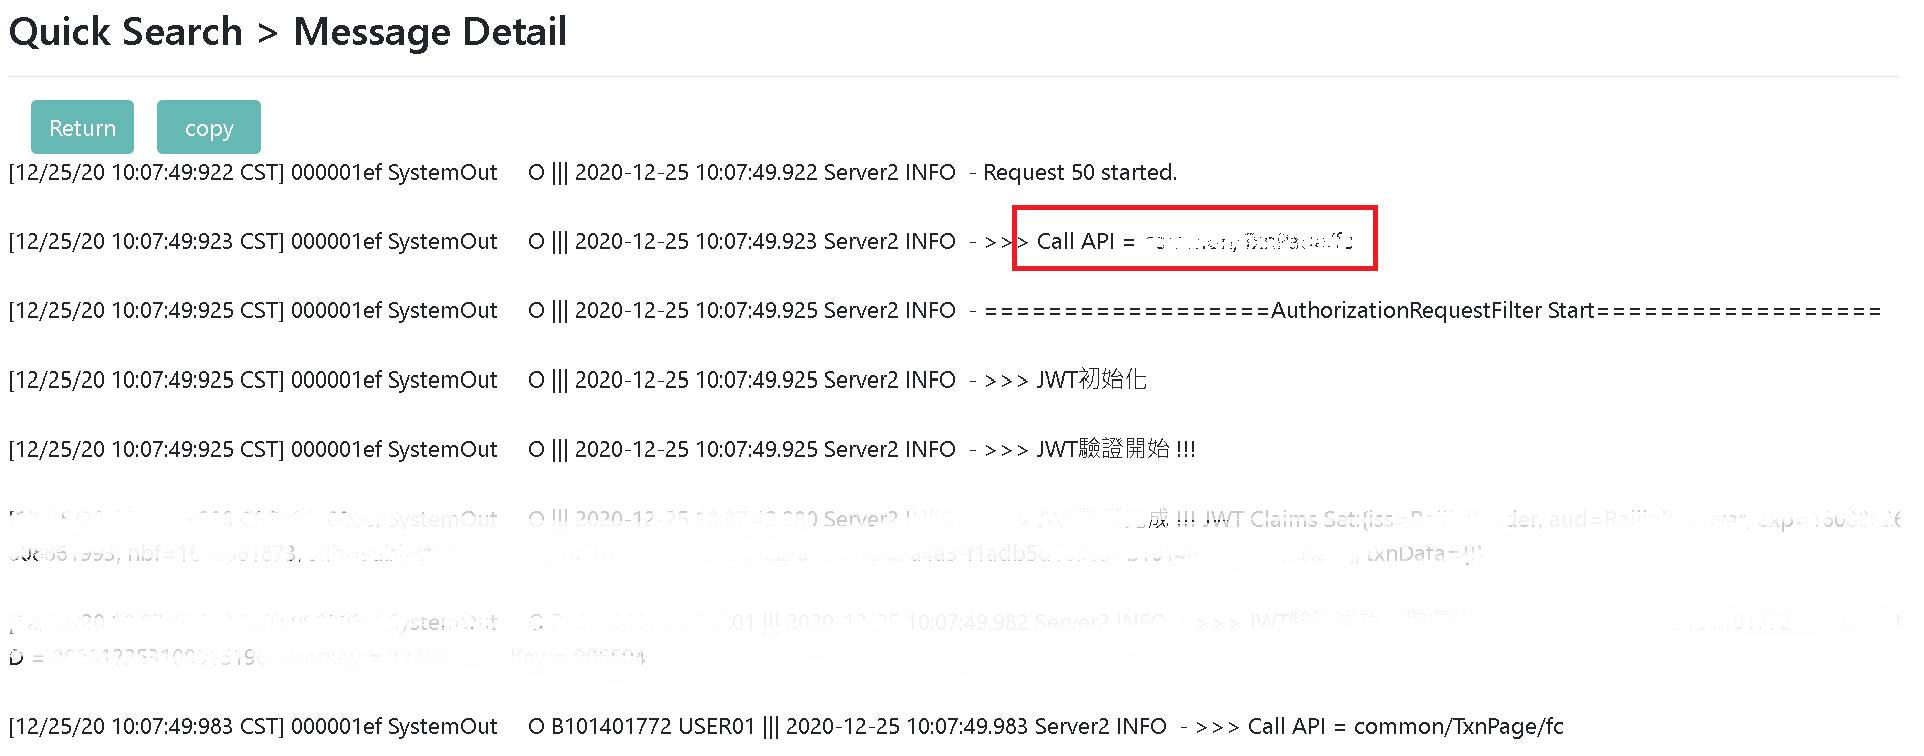
After receiving the task request, MIS member Tony initially believed that the anomaly was caused by one of the APIs. He needed to perform a “Dynamic Search” based on the predicted condition to verify and confirm the source of the anomaly in order to complete the subsequent handling. There were not a lot of clues when he first received the report. Since he was told to search the target data source in Log files, what he could do was explore the full texts in command lines, and narrow down the scope gradually in order for him to collect the critical information, but the entire search process was very complicated. After digiLogs was introduced, he found that the inconvenience in the past was immediately solved. In addition to using the “click mode” provided by the platform to perform a full-text index, he can also customize keywords or dynamic criteria to search the content, which makes the operation much easier and obtains better search results with accuracy.
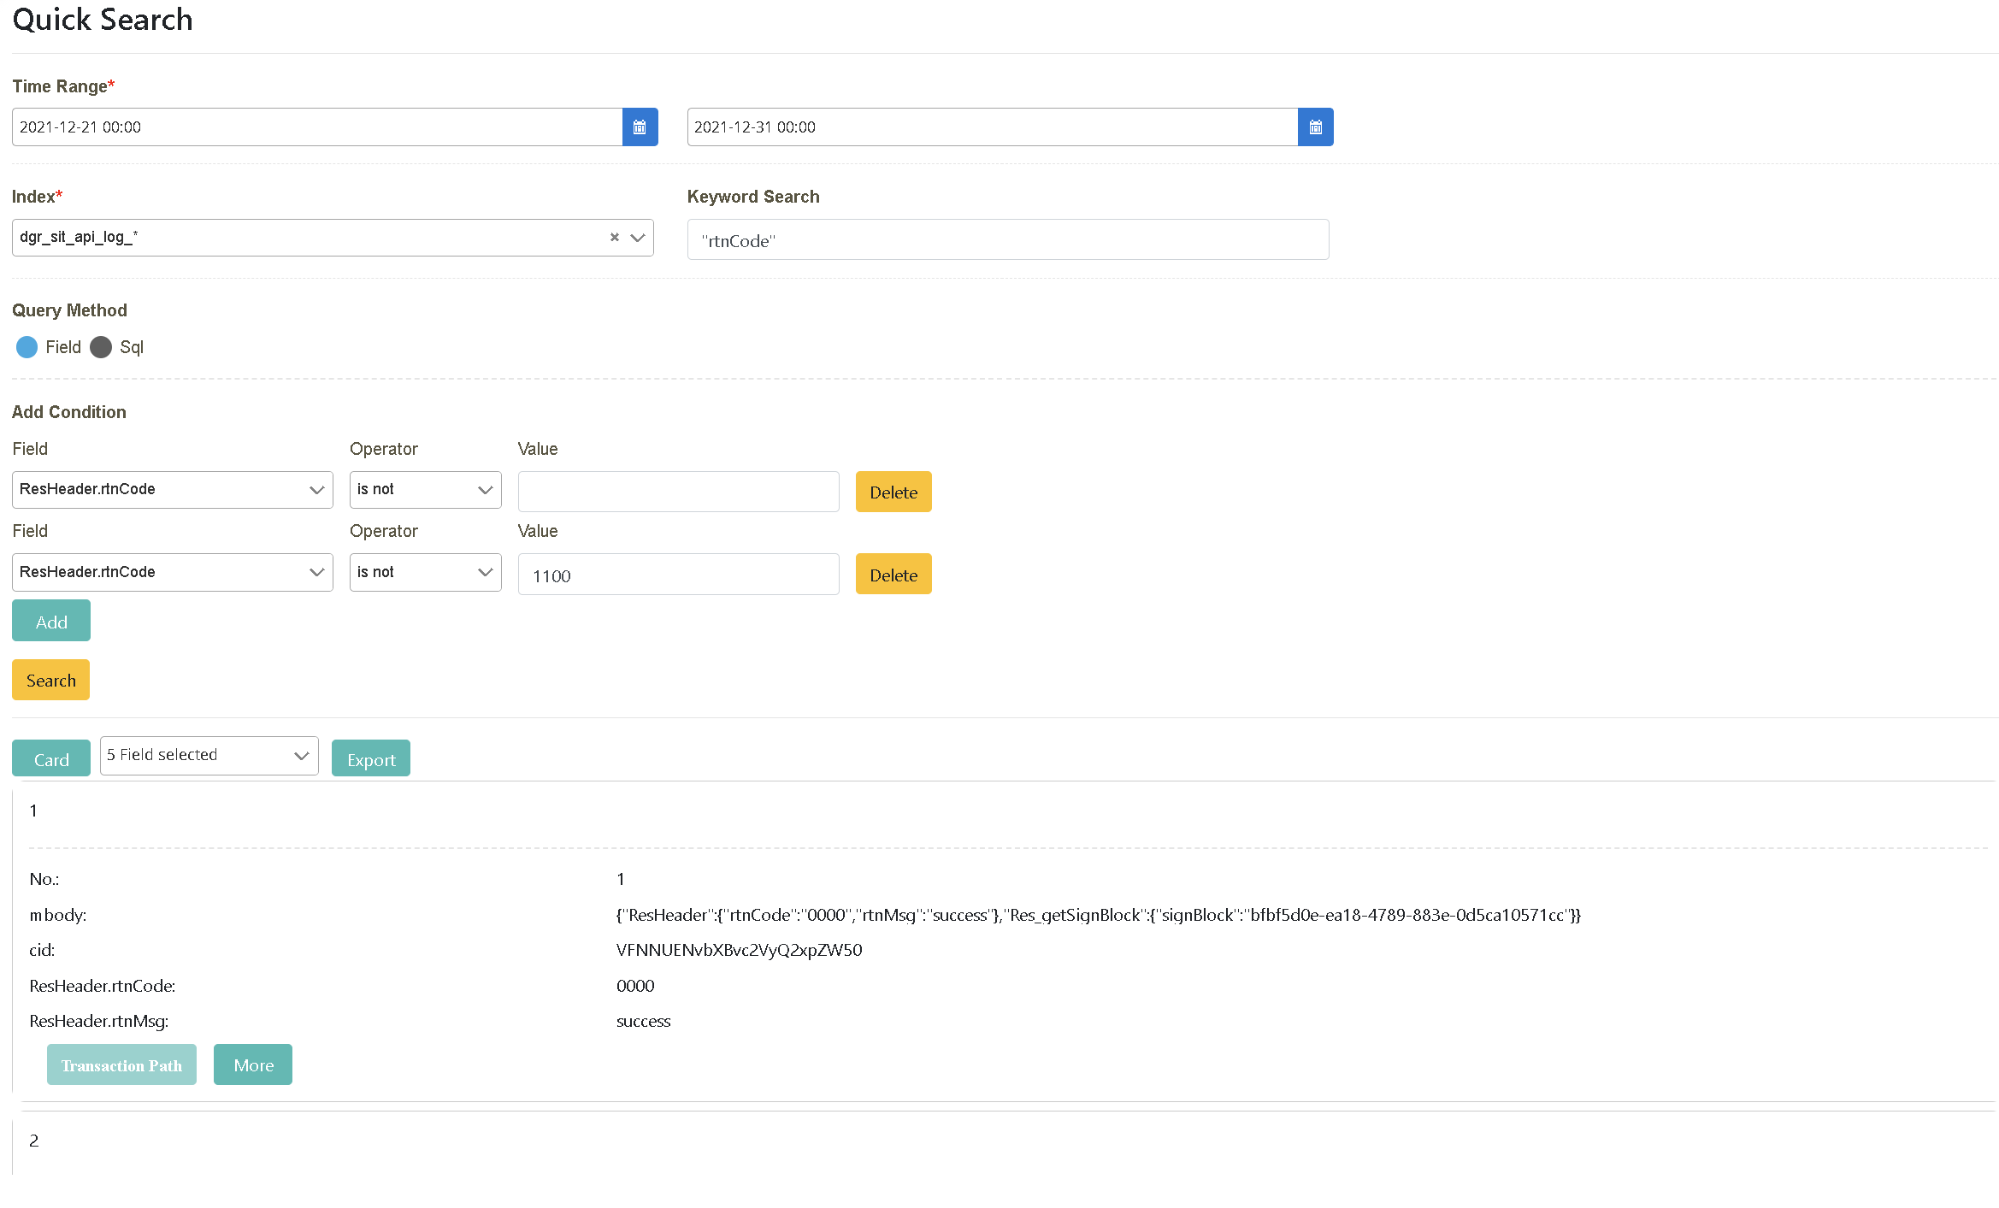
One day, MIS member Tony came to look for the cause of anomalies in the “cash flow (online banking) system” on the platform after receiving a search assignment. Because the system in question involves other systems, he needs to analyze specific keywords of every Log column in the process and index other sources according to the clues in order to find the associated Log data and its transaction information passing through the systems. In the past, a designated person would come to the system in question to search Log in order to find the cause of anomalies. If several systems were involved, he would have to switch between the systems to fully grasp the associated information and their correlation. The whole process is troublesome and lengthy. This situation can be greatly improved by using digiLogs. It provides services integrated from multiple sources. Once the target criteria are set for the search, it can find clues of associated data from other sources in the result.
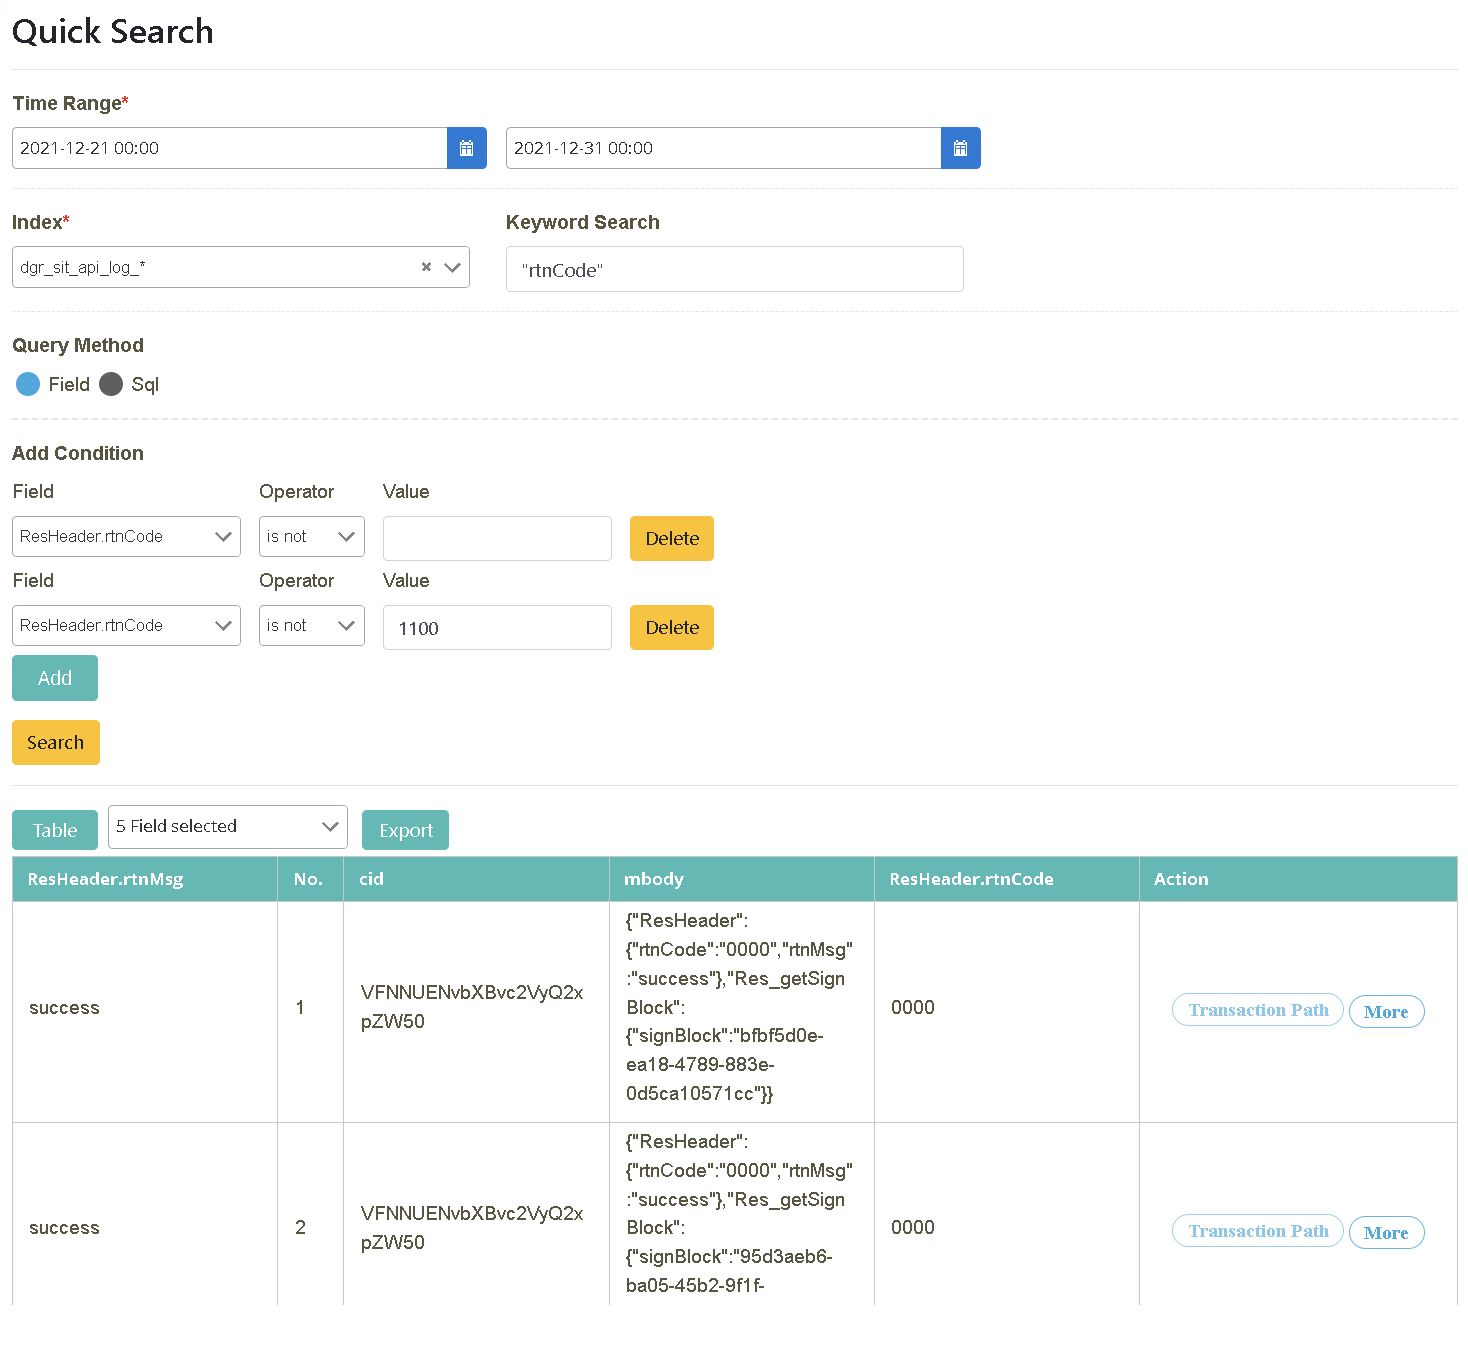
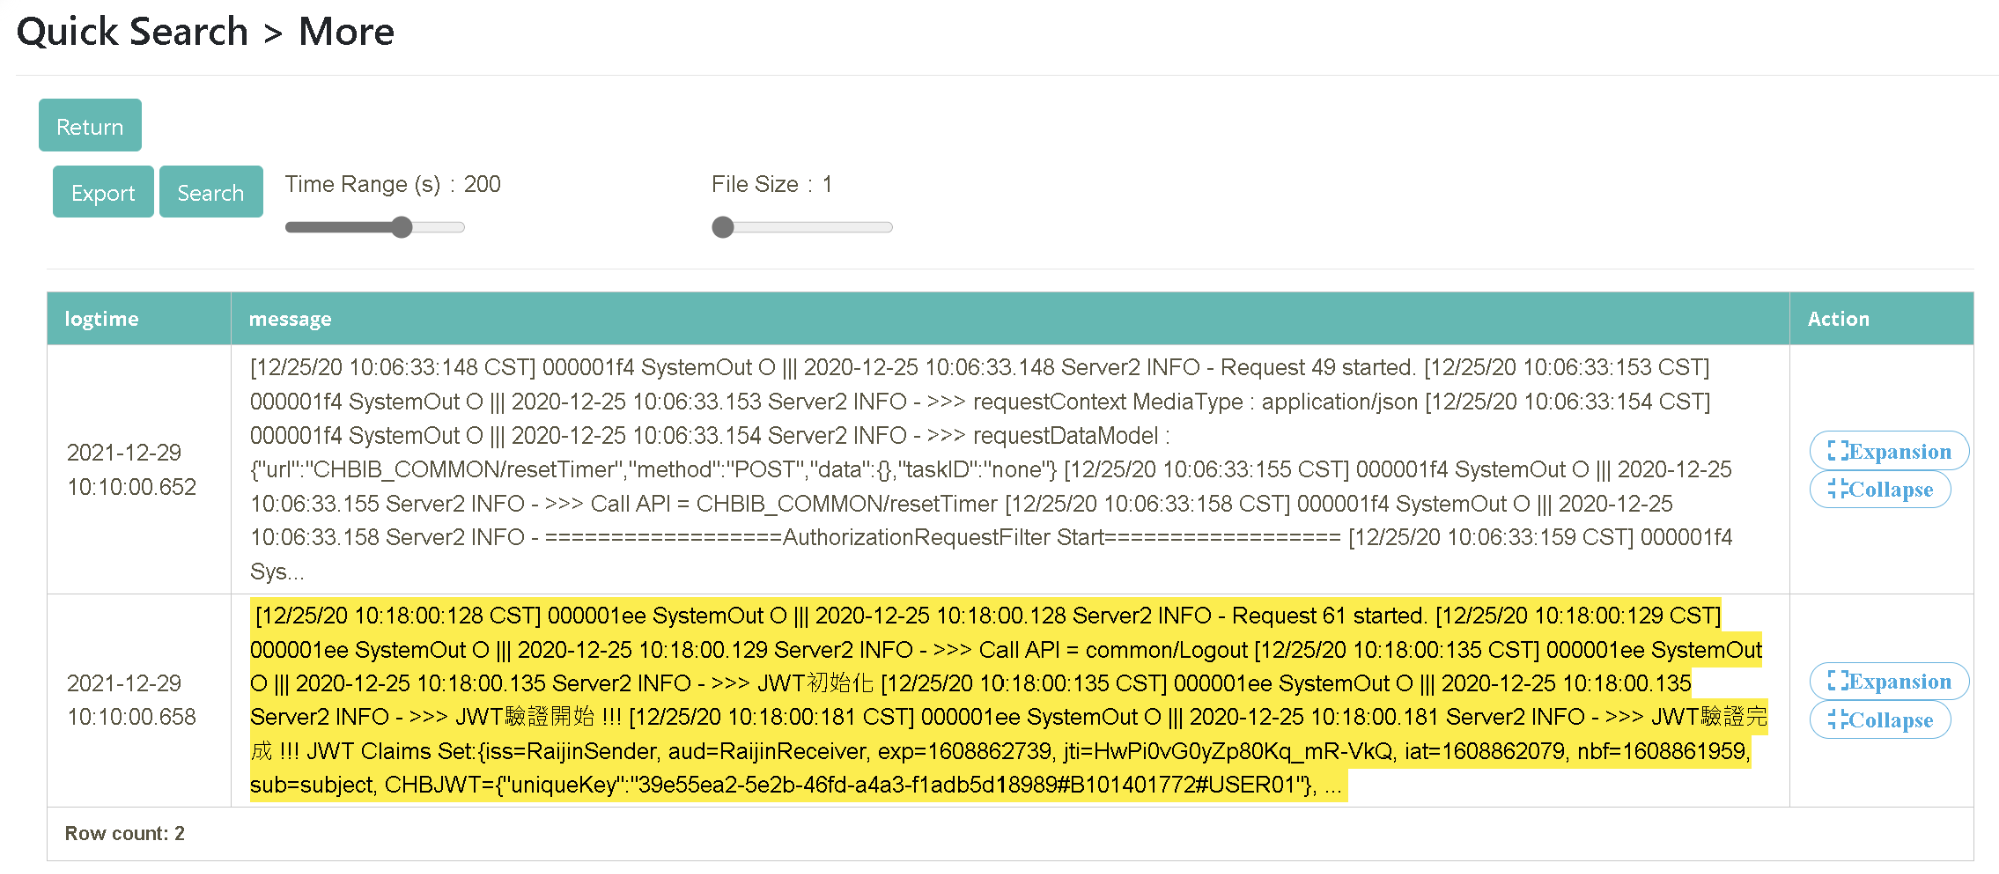
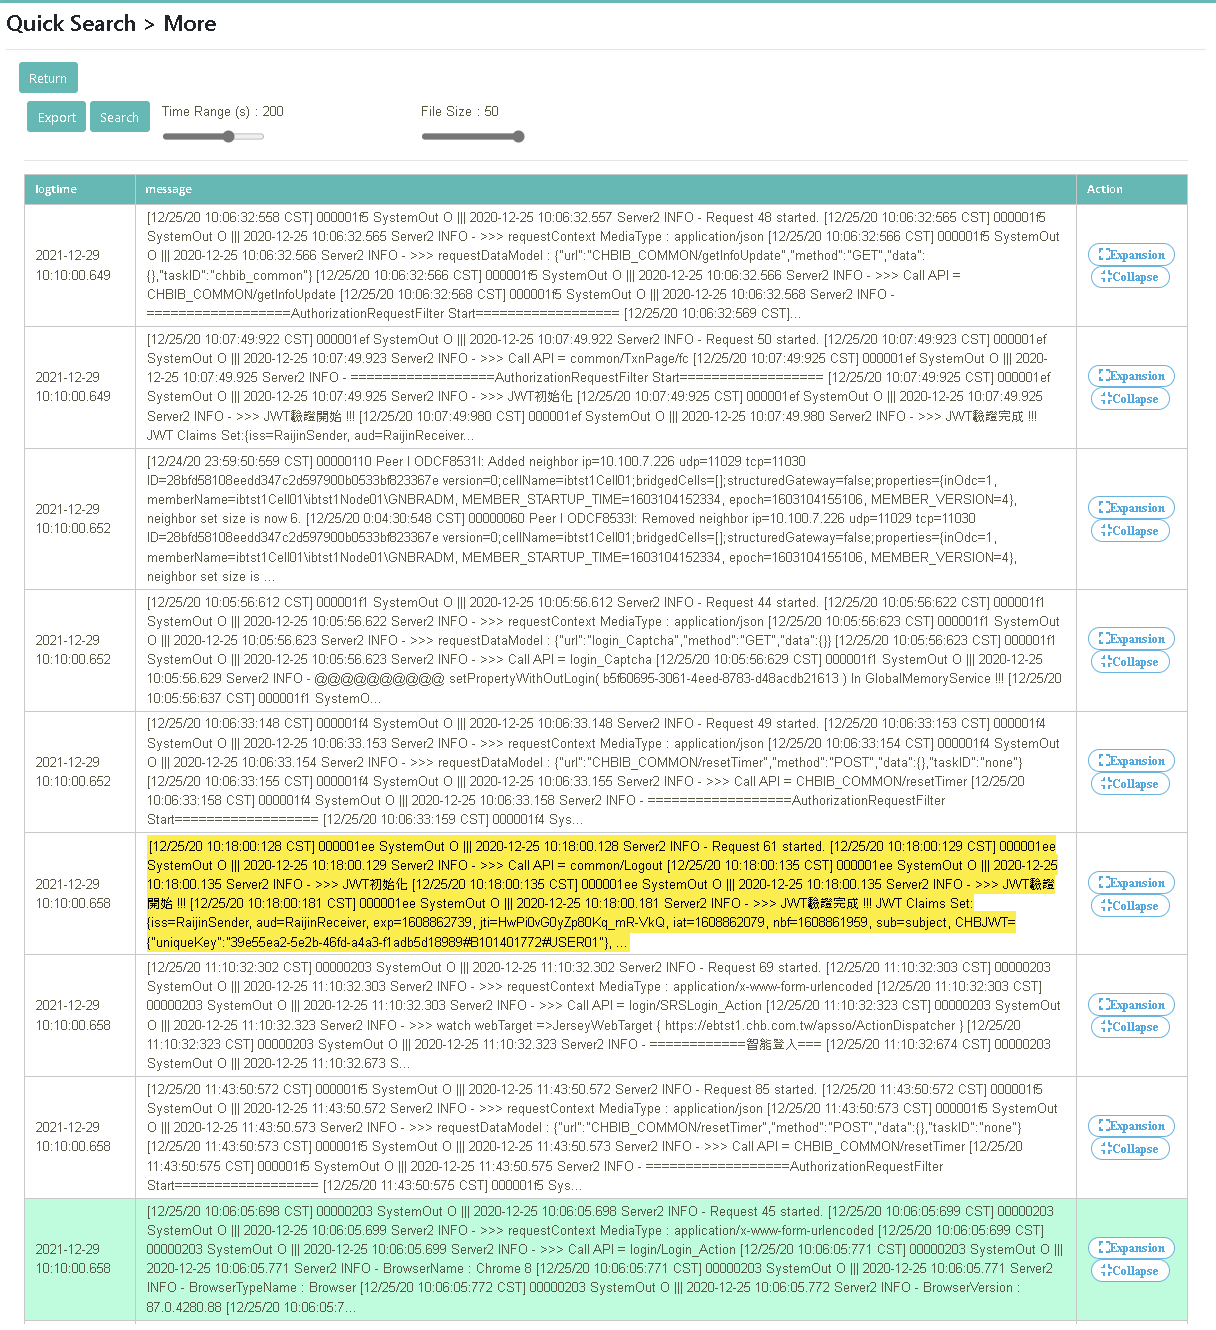
In this scenario, you can find out how digiLogs can find the continuous logs of the Log file by customizing time logs through “More Query” so that you can discover the root cause of system anomalies.
One day , after receiving an assignment, MIS member Tony came to look for the cause of anomalies in the “cash flow (online banking) system” on the platform. Because he wanted to know more about the root cause of system anomalies, he obtained the complete continuous logs of the Log file using the “Time Range” function provided by the platform for him to propose an appropriate solution. In the past, a designated person would use time as the center axis to search the entire continuous logs of the Log file in order to better understand it. digiLogs provides the same function as well. It can achieve the search goal by simply clicking or customizing the time frame to find the root cause of anomalies.
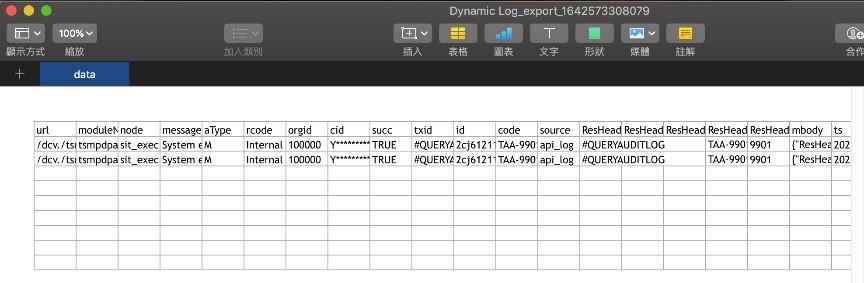
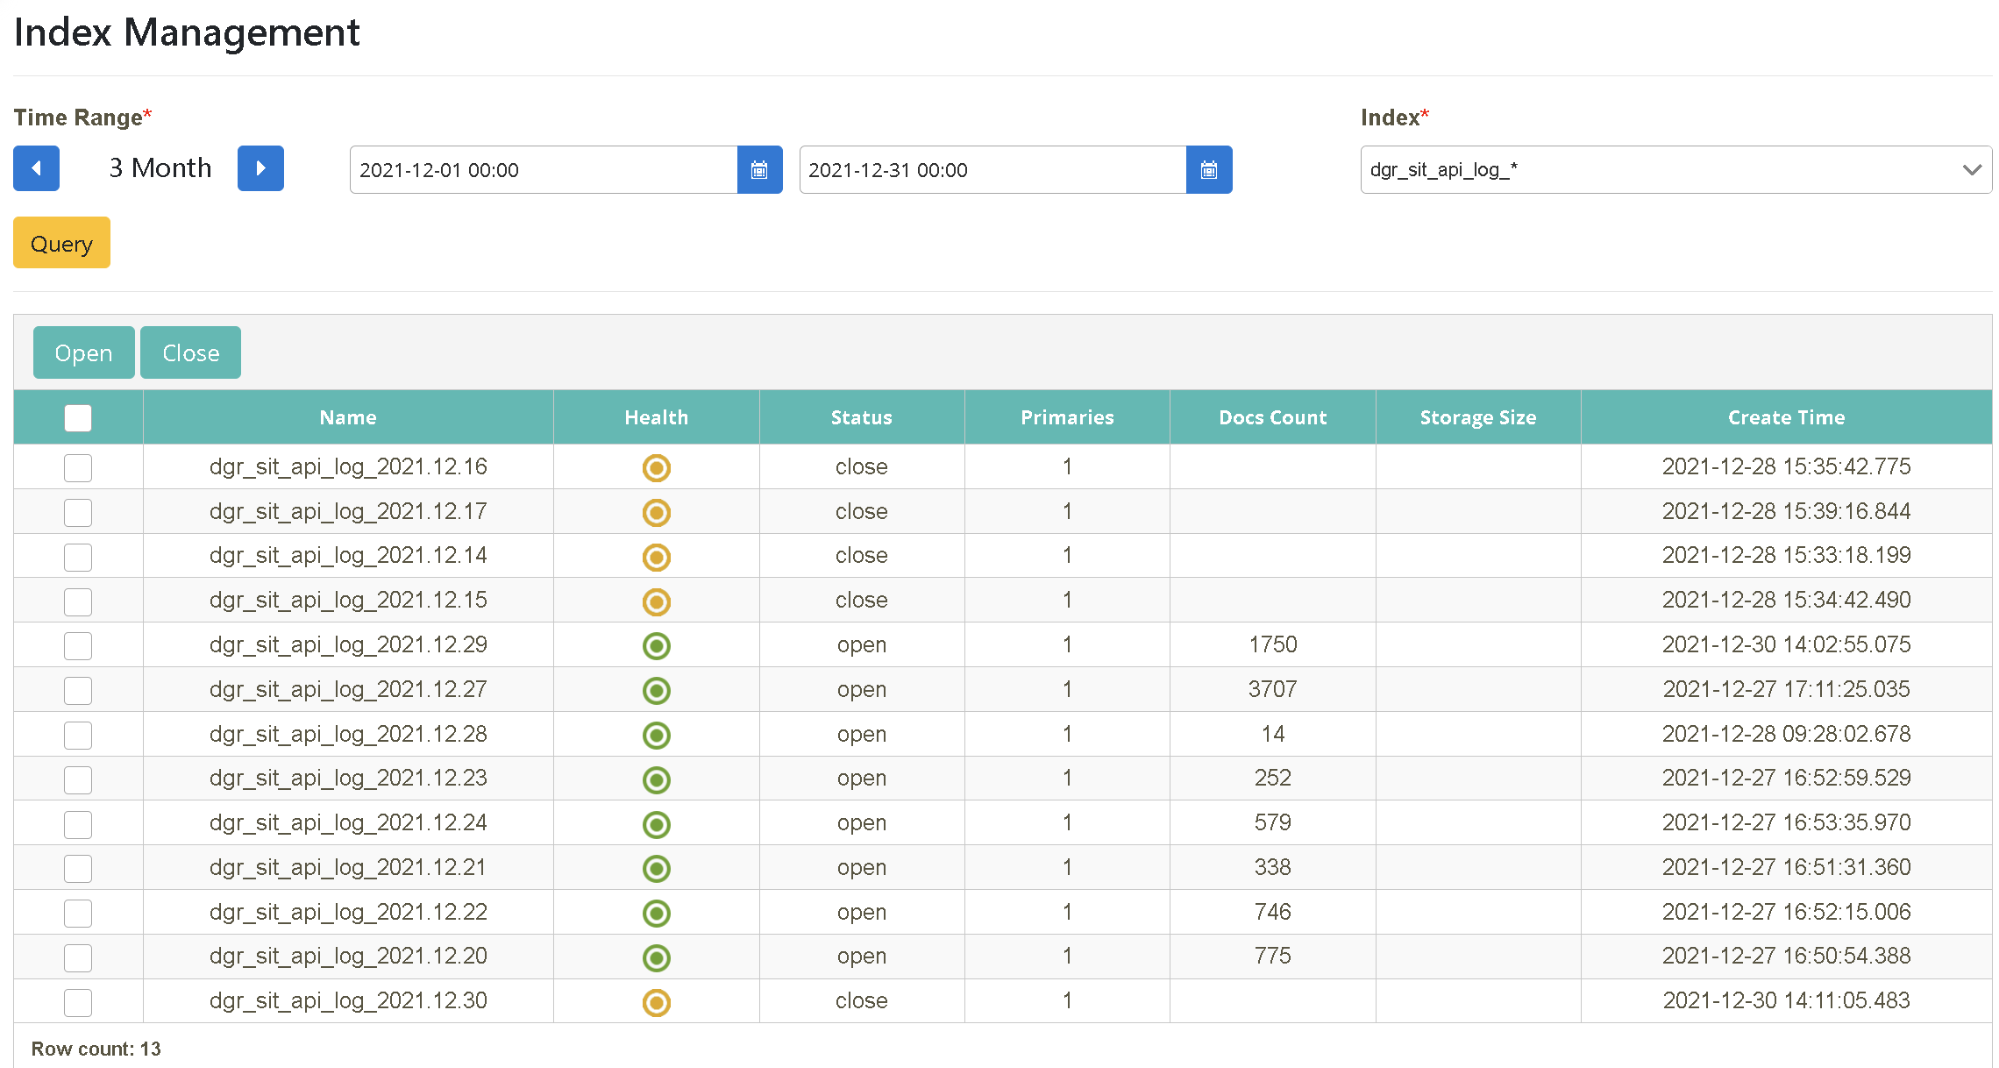
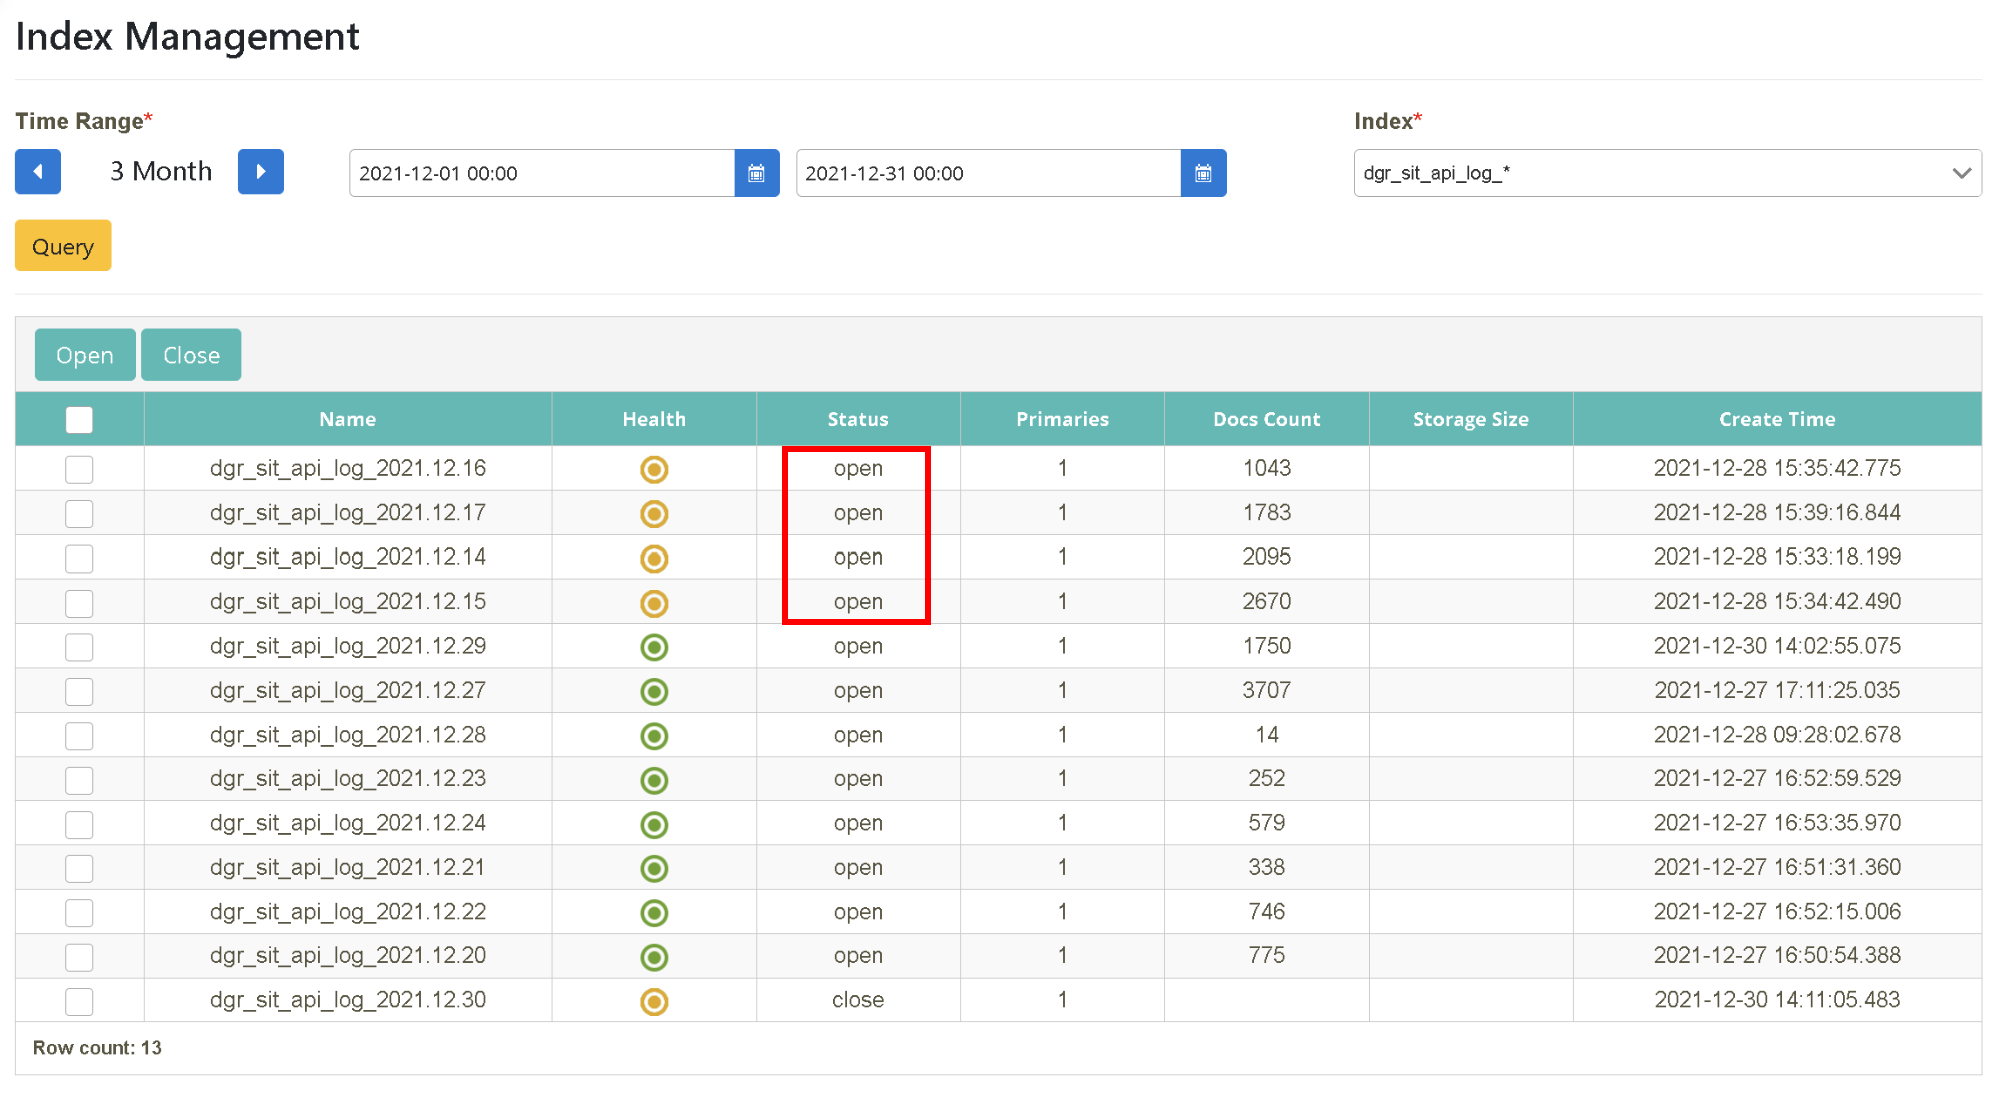
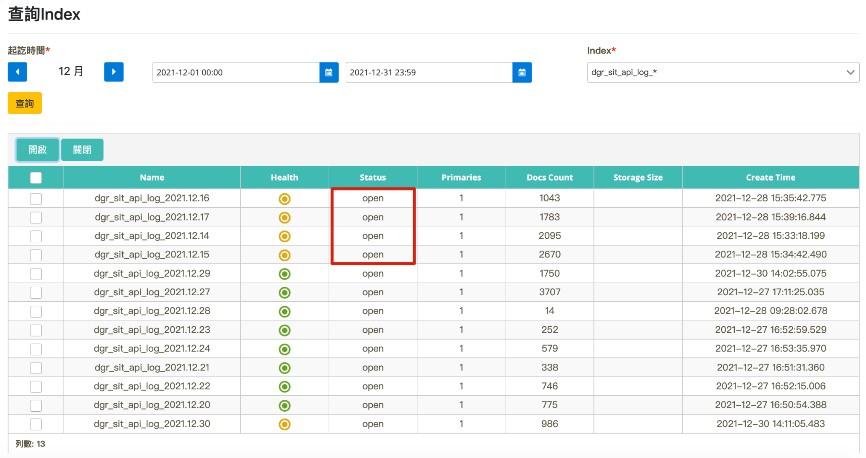
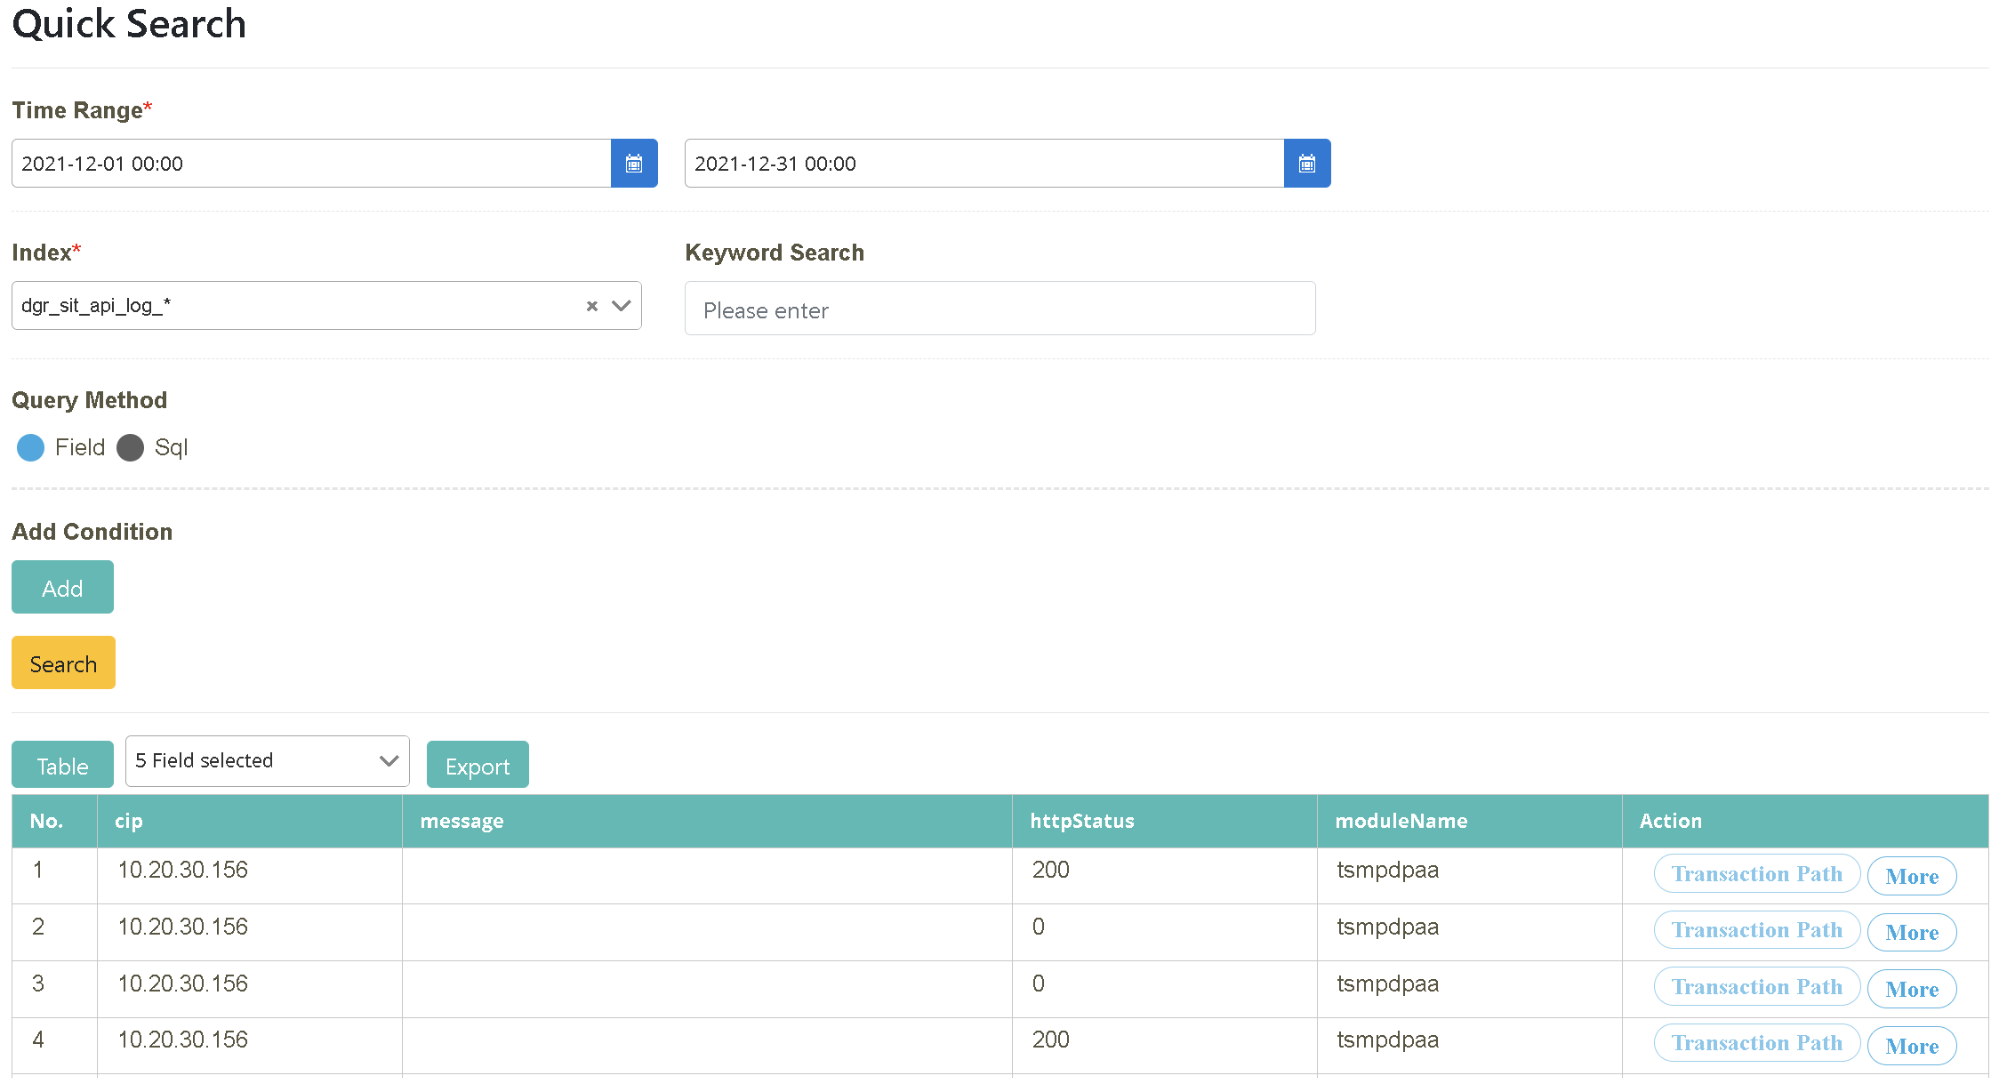
MIS member Tony received an assignment in January 2022. His supervisor asked him to verify the data because the API usage rate for that particular month was suspiciously too high. Therefore, he needed to query the API Log data in December 2021 and January 2022, compare the results of the data, and compile a comparative report. The data in December 2021, however, has become “cold data”. So he reactivated the setting of “cold data” function provided by the platform to query and export Log data in the “Query Index”. Afterward, he can summarize and compare the data to complete the report.
You can use the above-mentioned method to quickly reactivate the historical data for a short period of time in order to obtain files to be compared. After exporting, you can use them for MoM data sorting and draw charts.
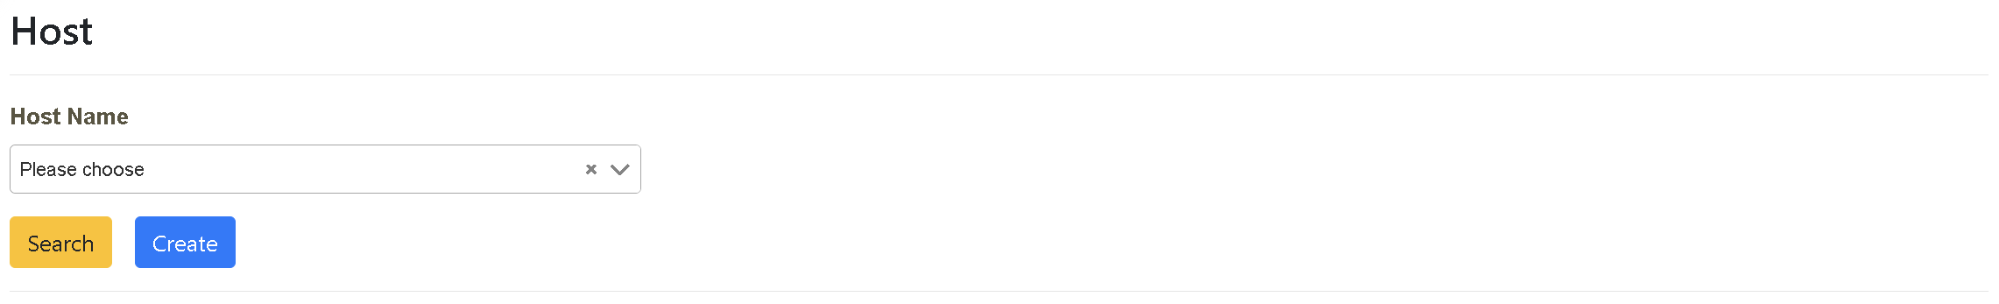
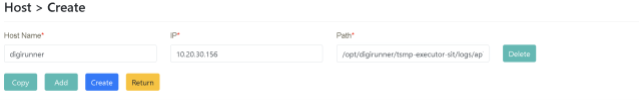
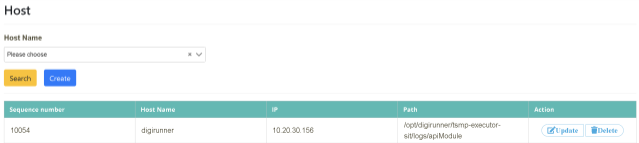
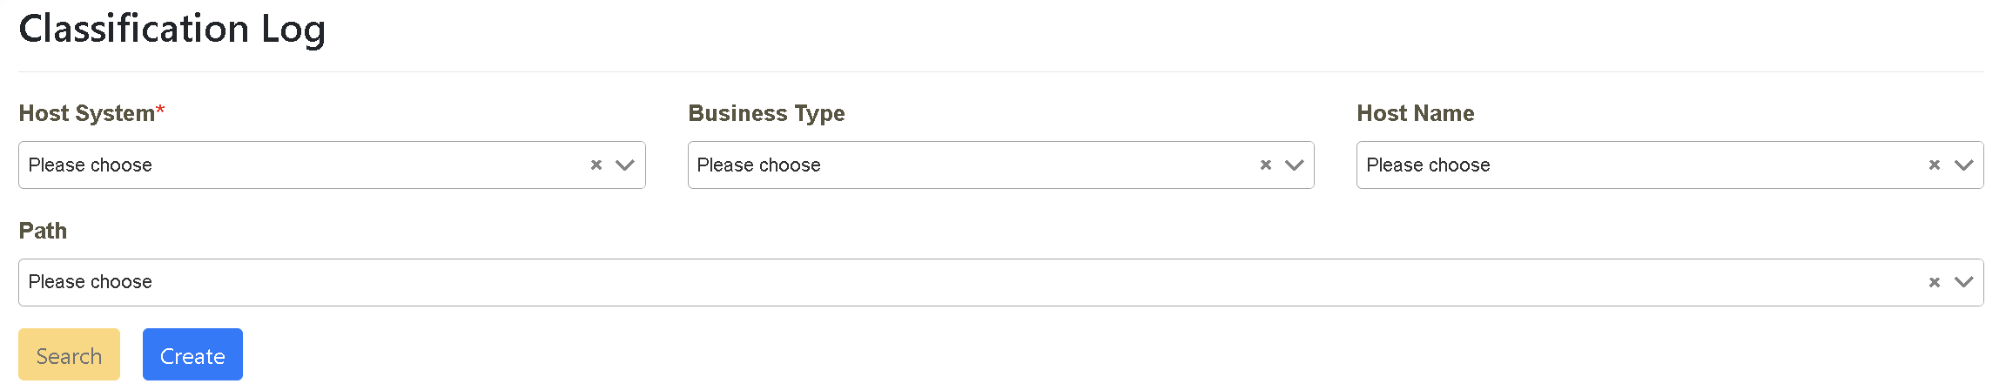
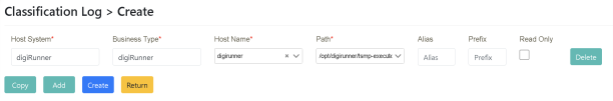
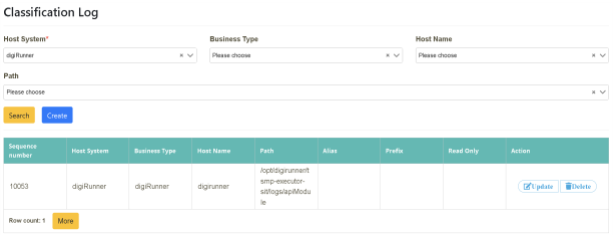
Enter the “hostname, IP, and directory path to store the Log file” to be used in the corresponding field and click [Create].
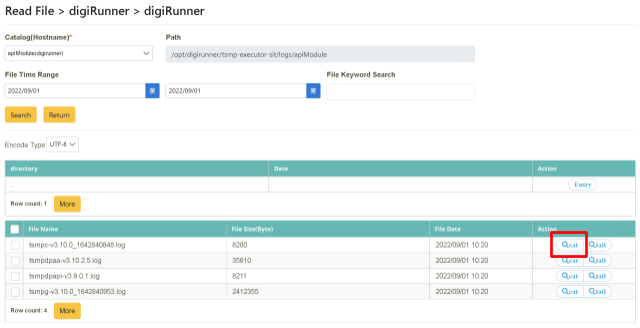
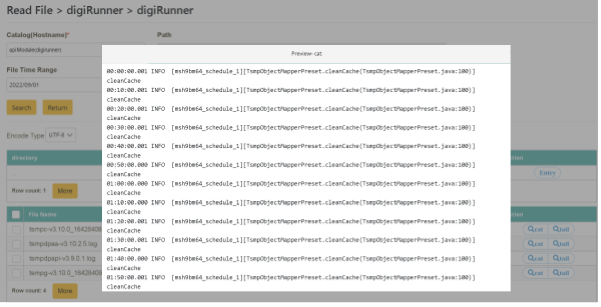
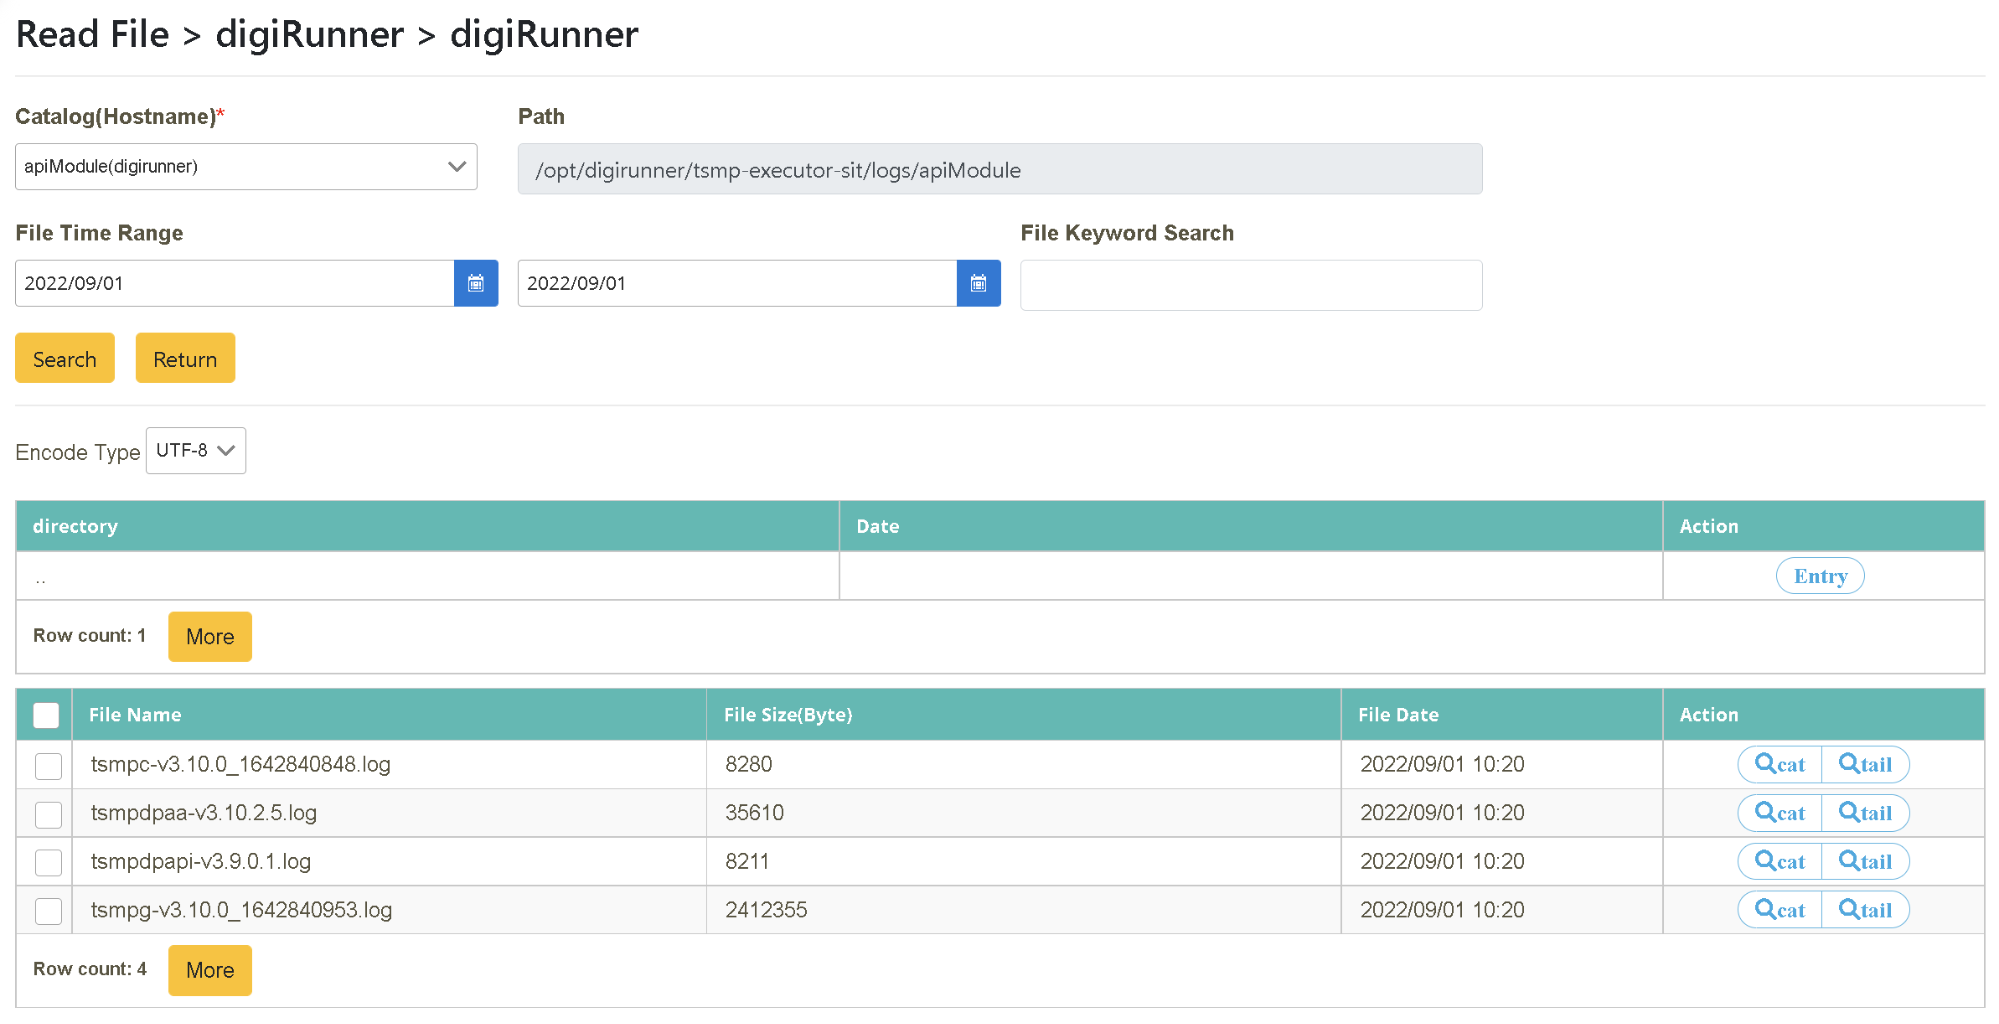
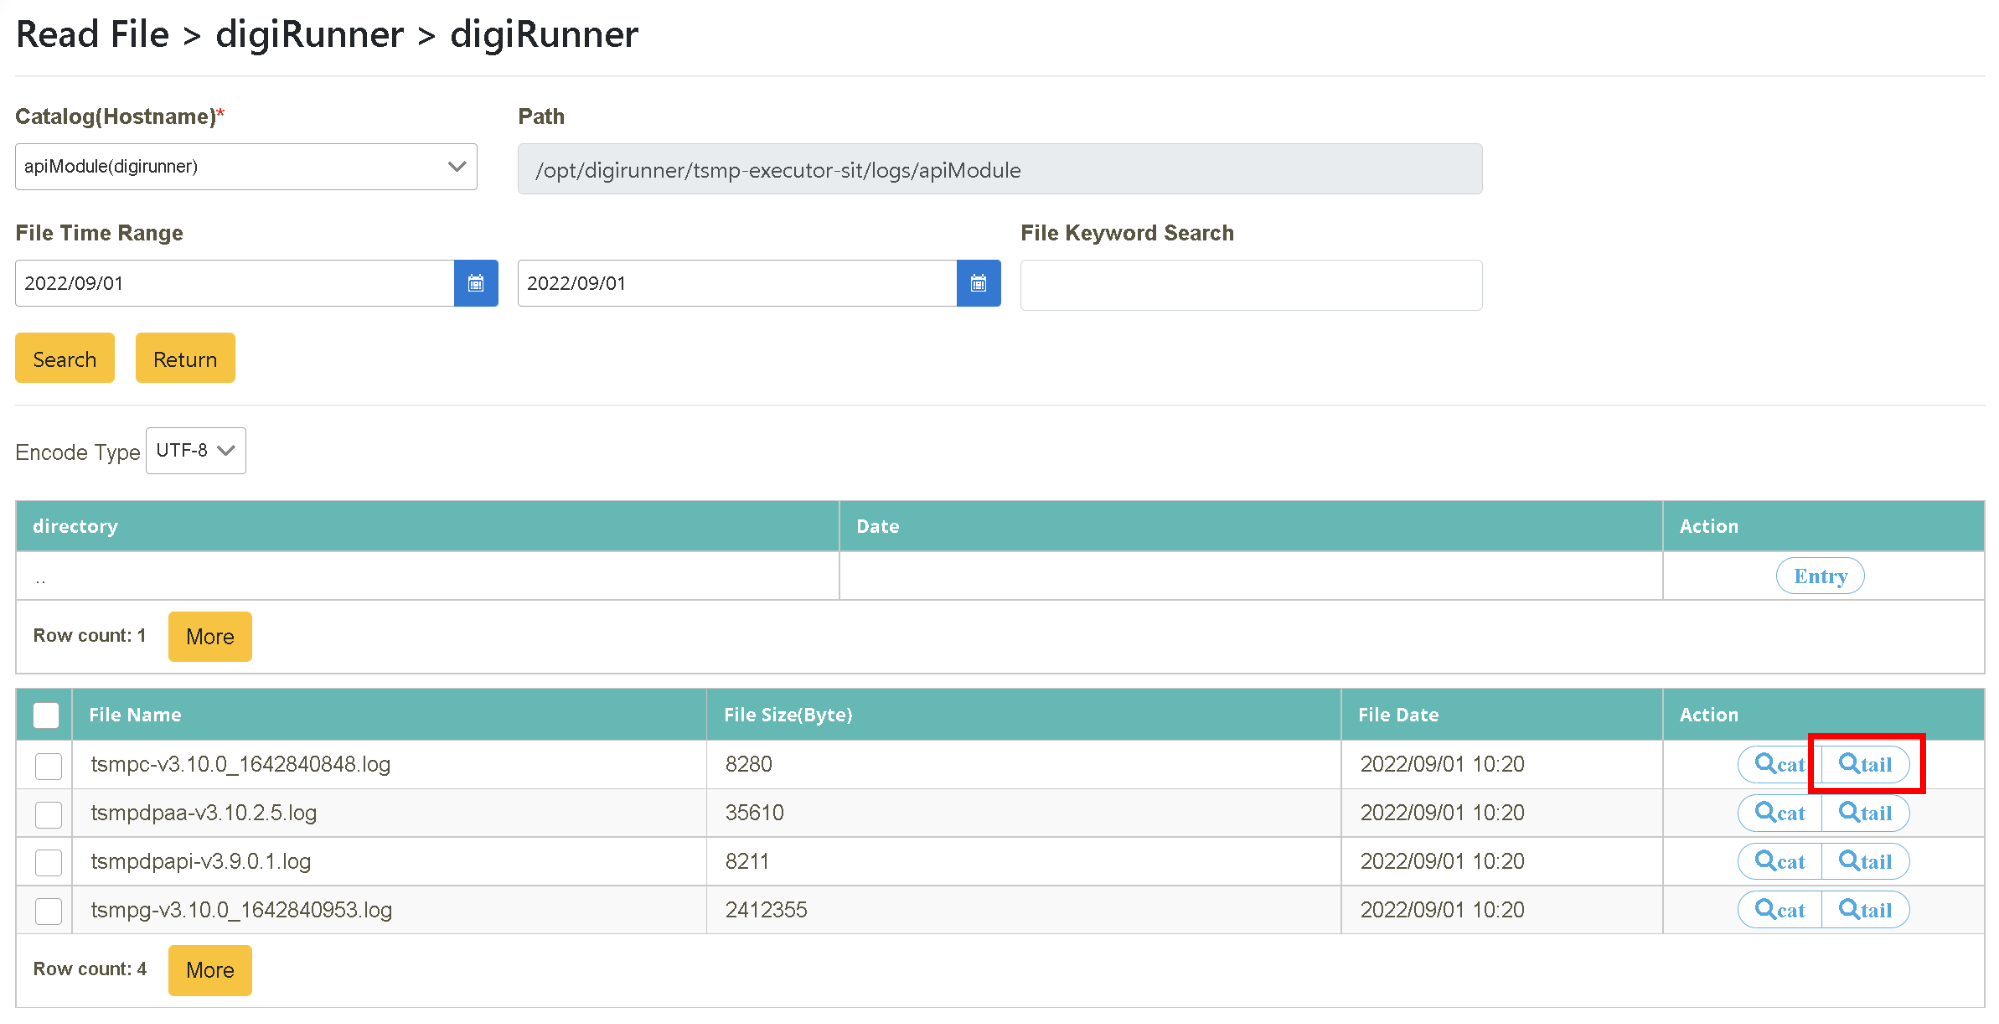
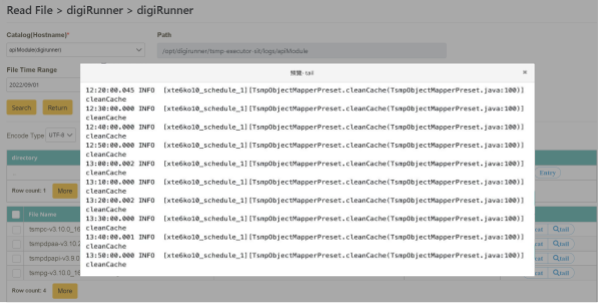
Click on “Log Query” > “Read File” to select the target “system” and “business”, and then select the target “Directory (host)” (host=apiModule(digirunner)). Select the starting and ending time for the search, or enter the content to be searched in “Keyword Search” (dgr-cus-etb_cg-v3. 8.4.24.log) and click [Search].