Case Study:

In this scenario, you can find out how to use digiLogs to construct an organizational chart and grant various access permissions and functional modules of the platform to different levels of users.
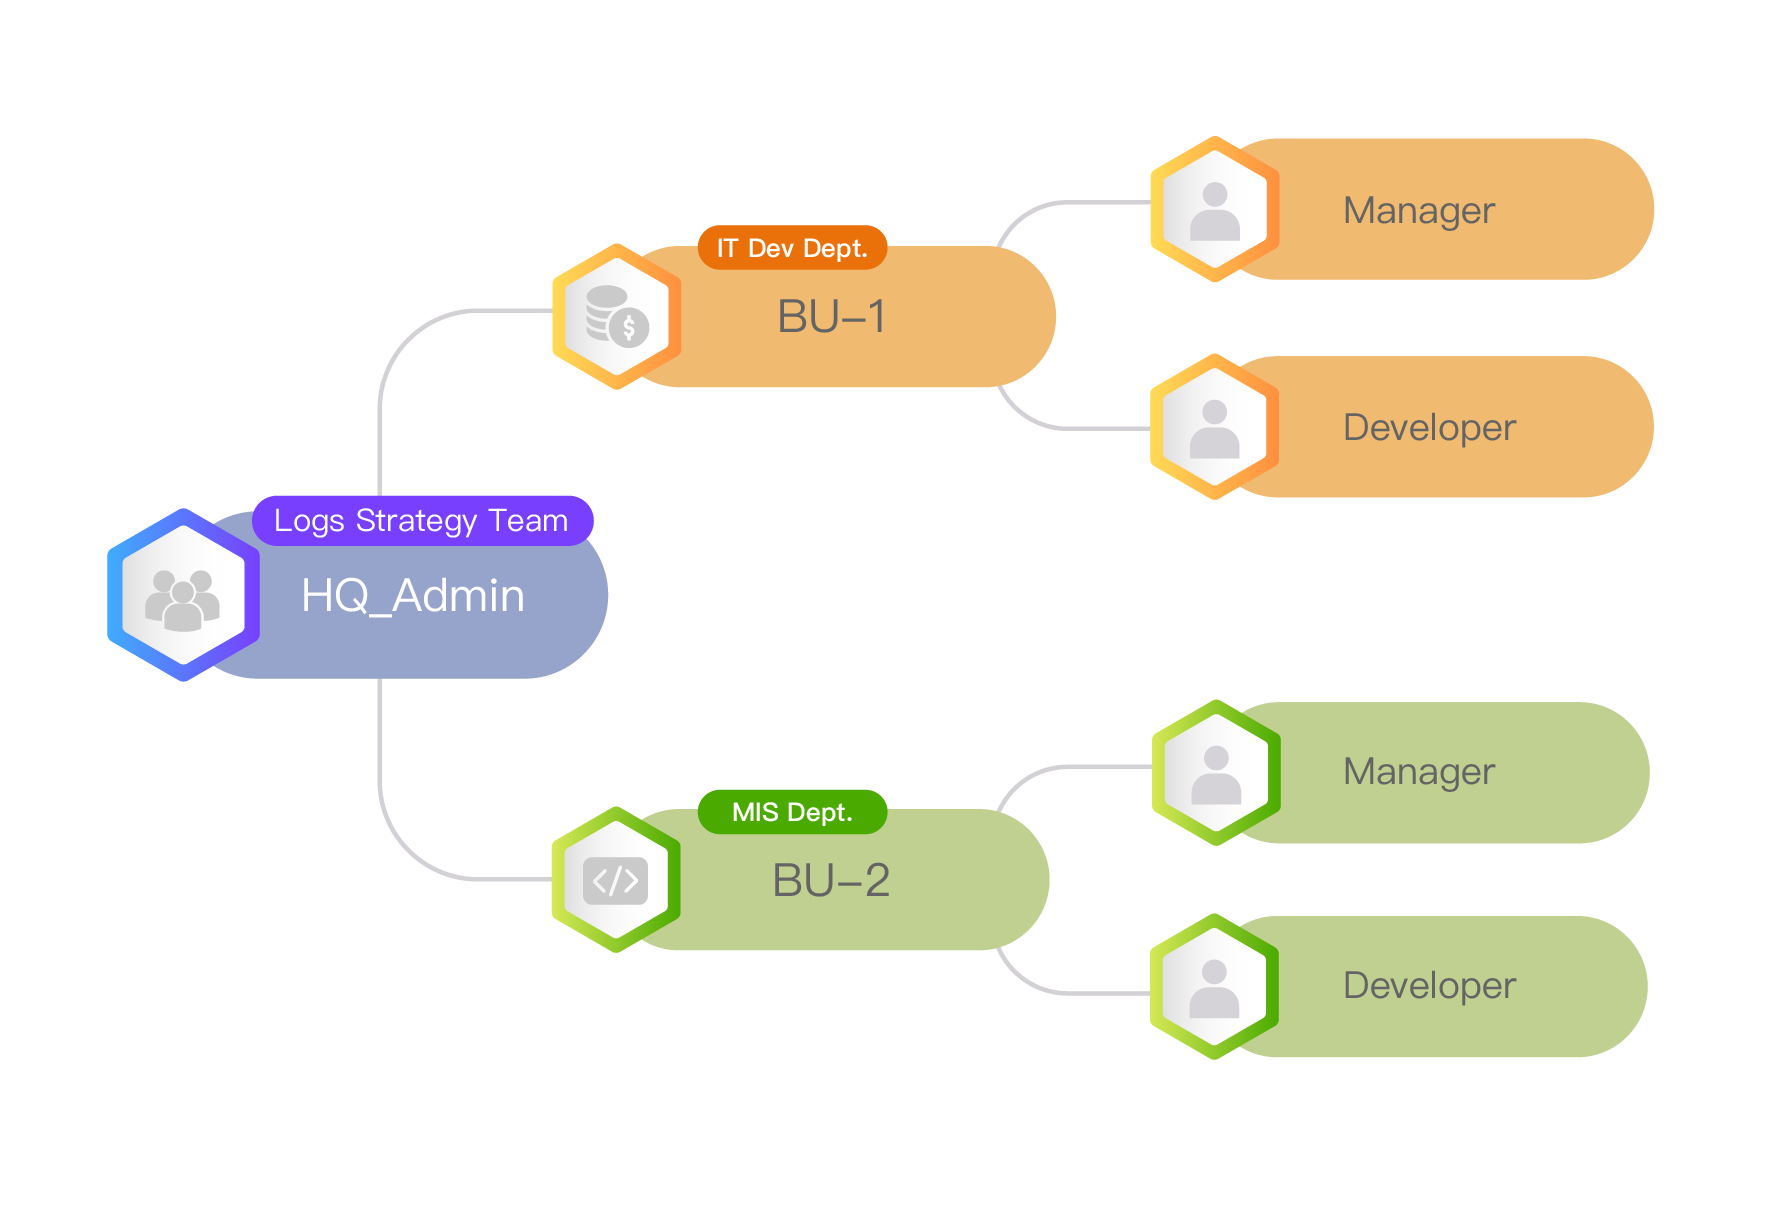
Logs management platform for their software systems and hardware equipment. Both departments hope to have their own organizational access regulations and each needs different functional modules for members of different job responsibilities (Manager, Developer) to execute corresponding tasks.
The authorized permissions for BU-1 Manager include:
Permissions Authorization:
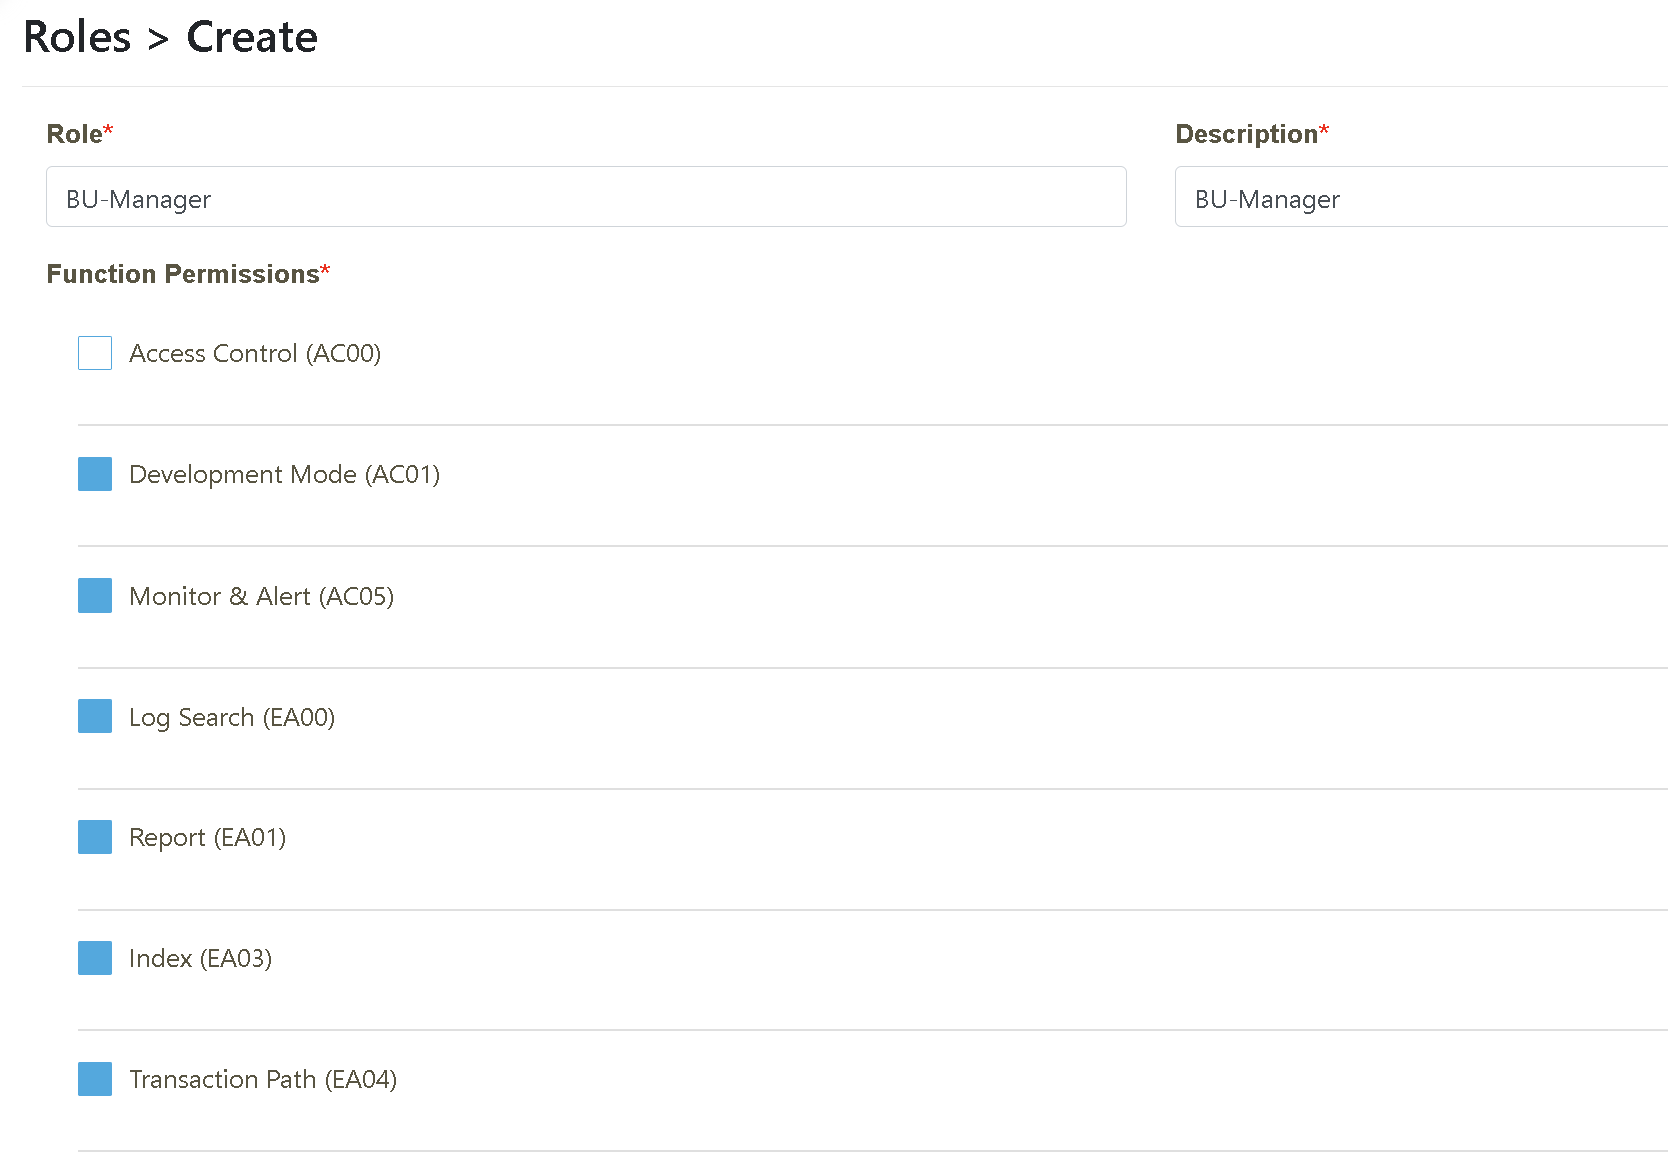
Role Authorization (as BU_Manager, the designated person has the right to authorize his subordinates with the following roles):
Function Description


Click on “Access Management” > “Role Maintenance.” Click “Create” to create a new role.



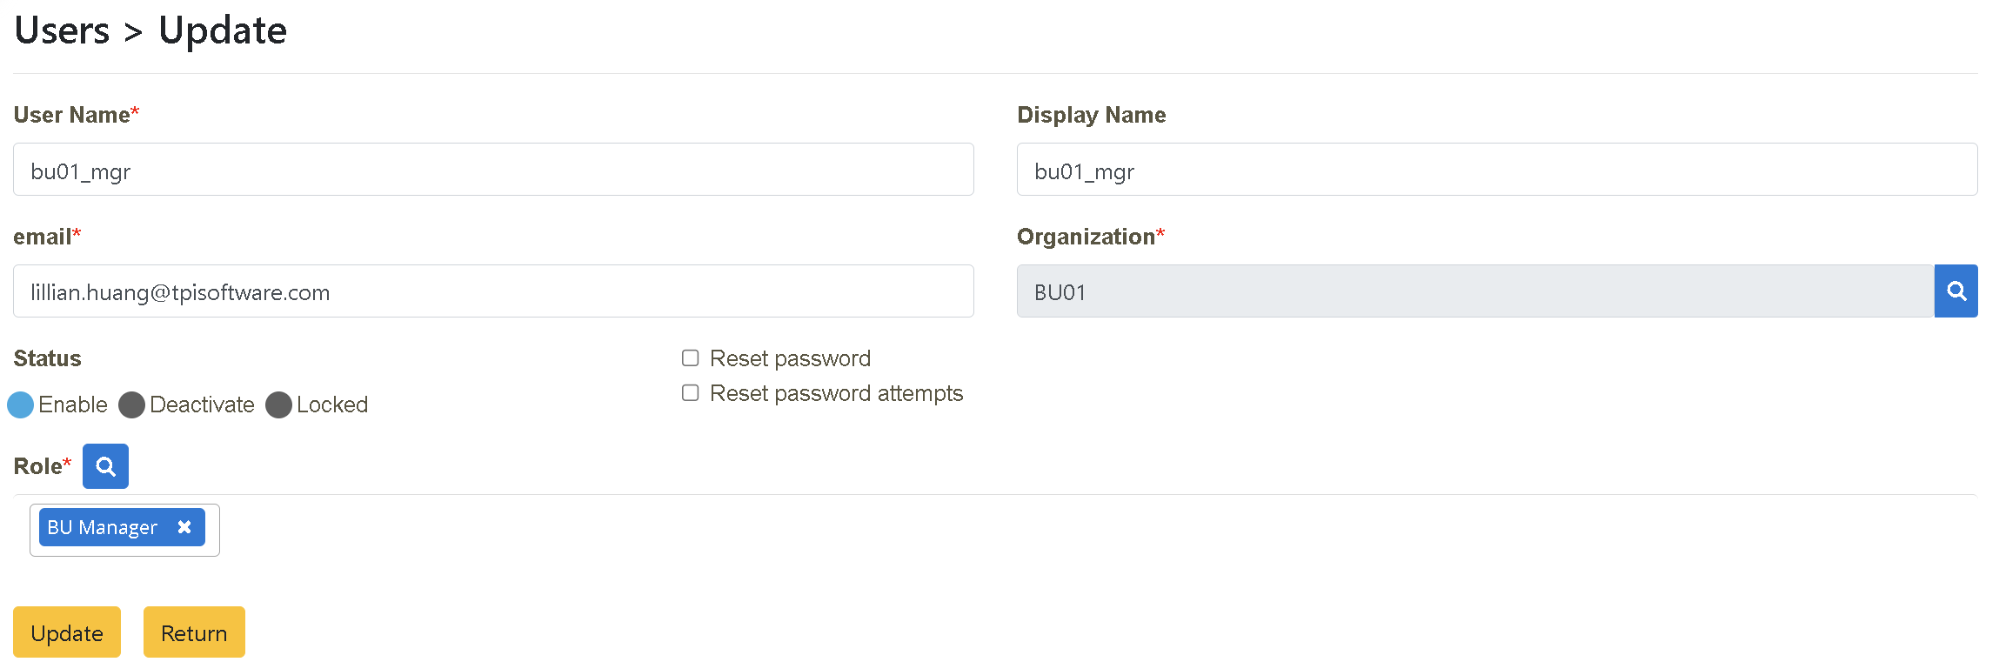
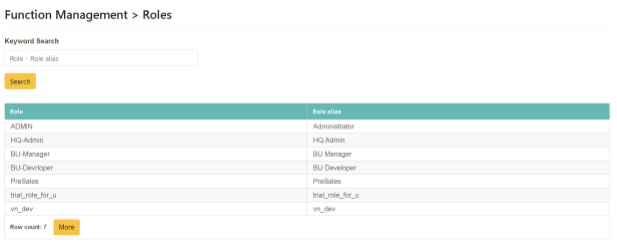
As the director of the MIS department, Alex needs to compile a report regarding the open users on digiLogs management platform and their permissions to the corresponding functions for the company’s information security audit. He also thinks that the “transaction monitoring” function names on the platform do not relate to their functional meanings intuitively. Therefore, he wants to make some adjustments according to the company’s or internal idioms so that all the listed functions in digiLogs and the information of users assigned to each function can be understood with a quick look through “Function Search.” If he needs to modify the functions’ names and descriptions, he can do so on the platform interface by himself as well.


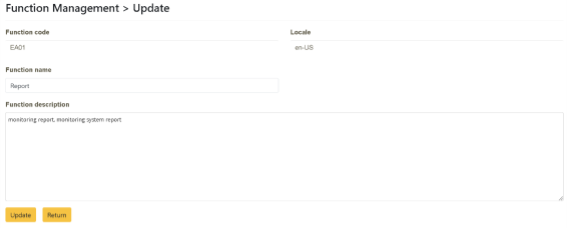
Click on “System Function Management” > “Function Maintenance” and enter the information you want to search (Function Code or Function Name, EA01). Click “Action” >[Update].

Enter the name to be changed in the “Function Name” field. Enter the description (Monitoring Report, Monitoring System Report) to be changed in the “Function Description” tab and click [Update] to complete.

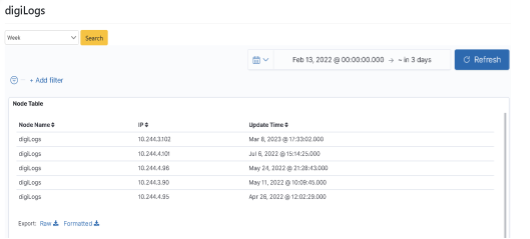
In this scenario, you can find out how to monitor the operation (health) status of digiLogs through the search interface provided by the platform.
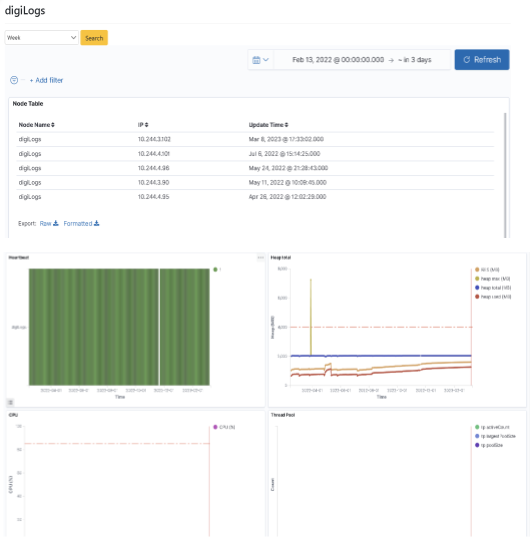
IT developer Joe felt the search response time was longer recently when he worked on the platform. So he wants to check on the status of the system operation performance. With “digiLogs Server Dashboard”, he can now quickly review system health status and other indexes, including Heart Beat, Heap, CPU, and Thread Pool.

After logging in as bu01_dev, click on “Monitoring Management” > “digiLogs Server Dashboard” to select the time interval (Week) to be searched, and click [Search].

In this scenario, you can find out how to use the search interface to search the operation behavior records of all users on the platform.

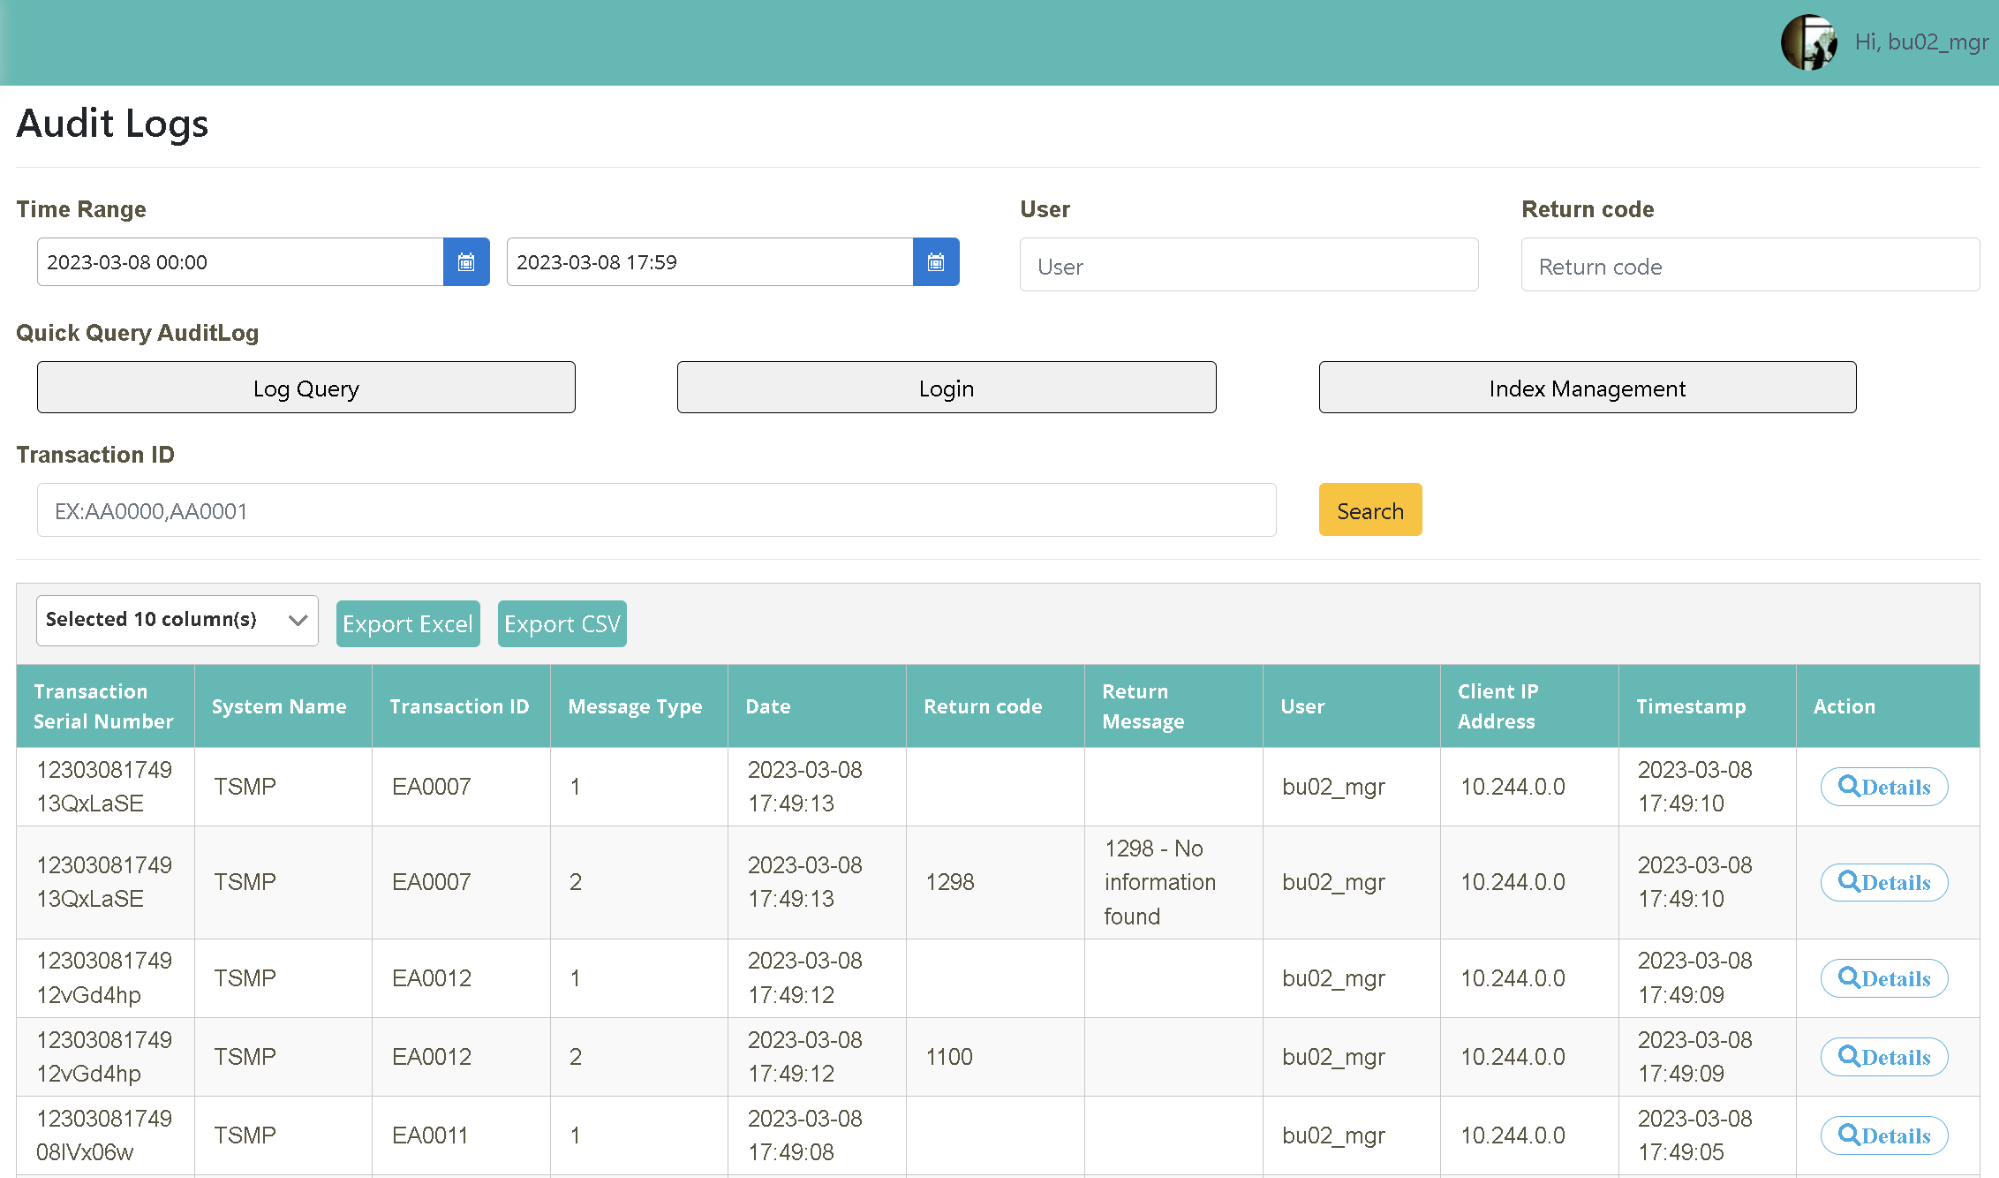
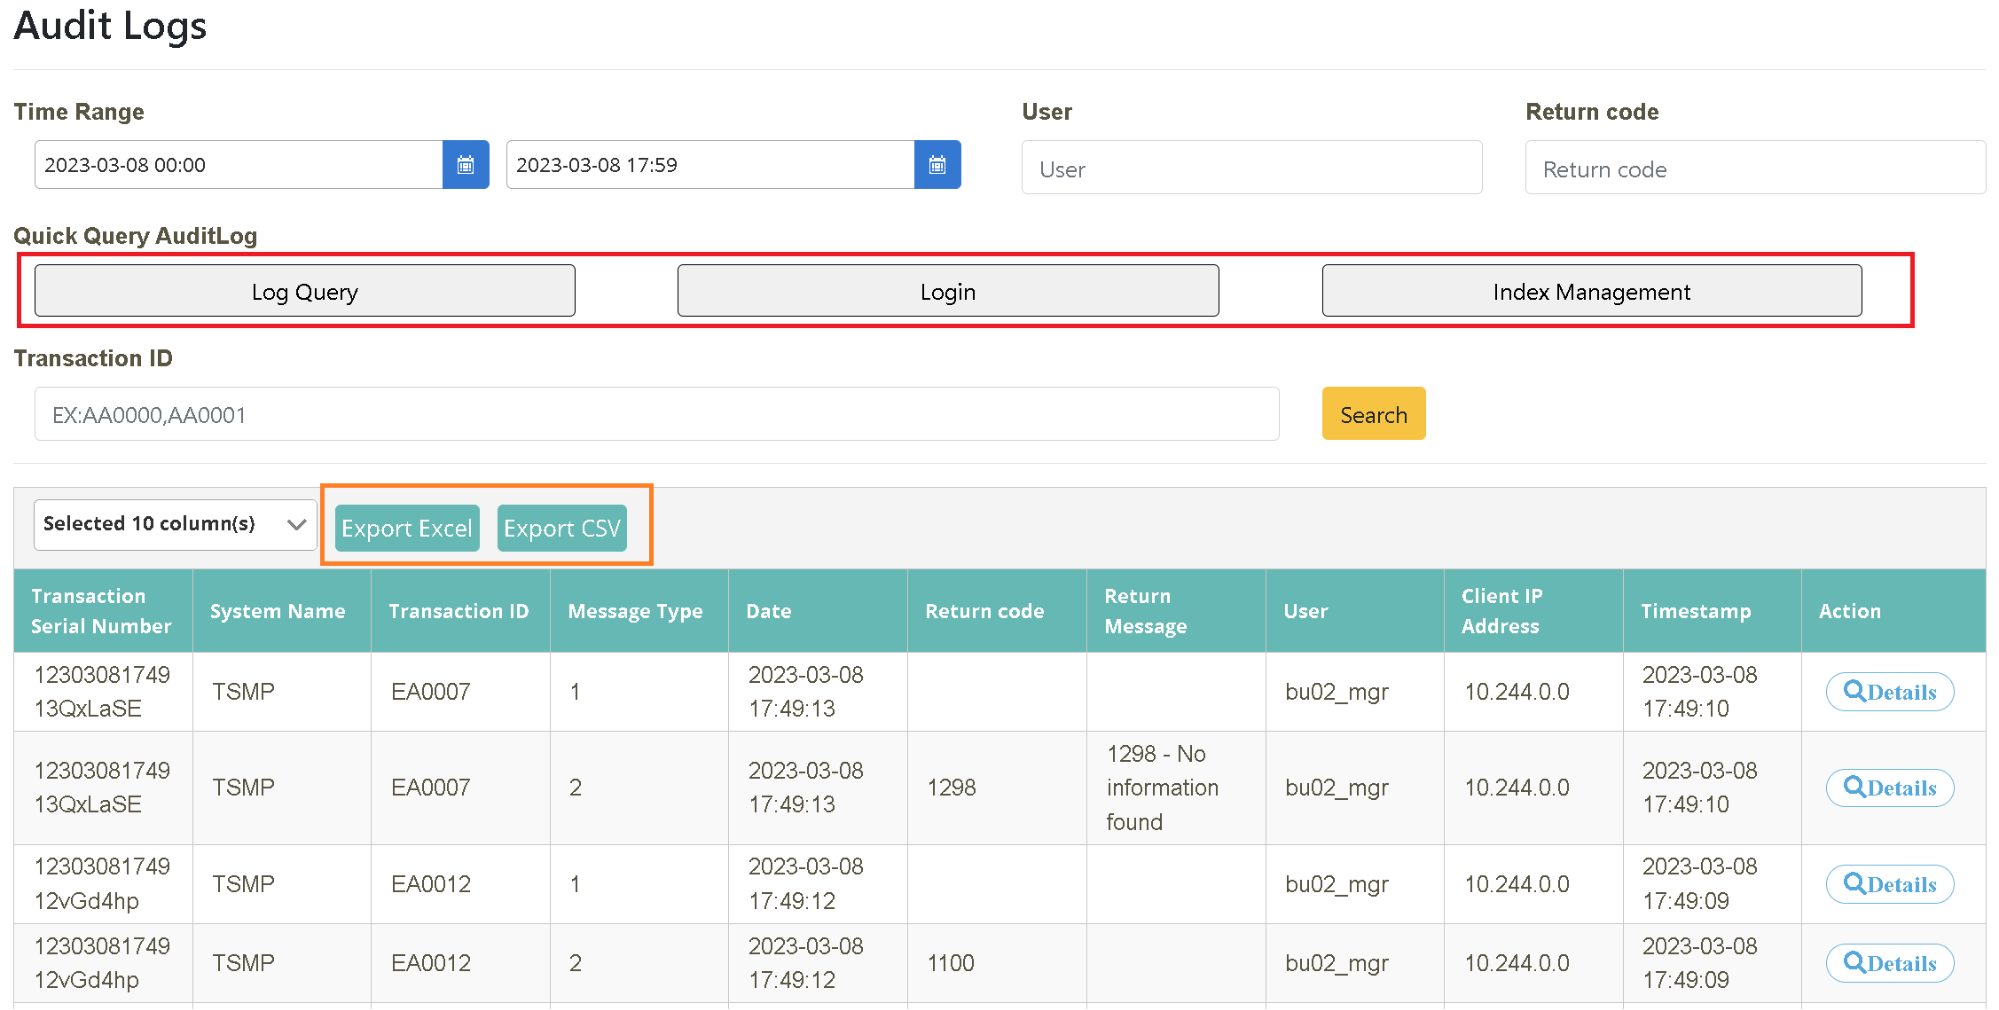
Perform a quick search with the shortcut “Log Search, Login and Index Management” and compile a report after exporting the search results to a file.
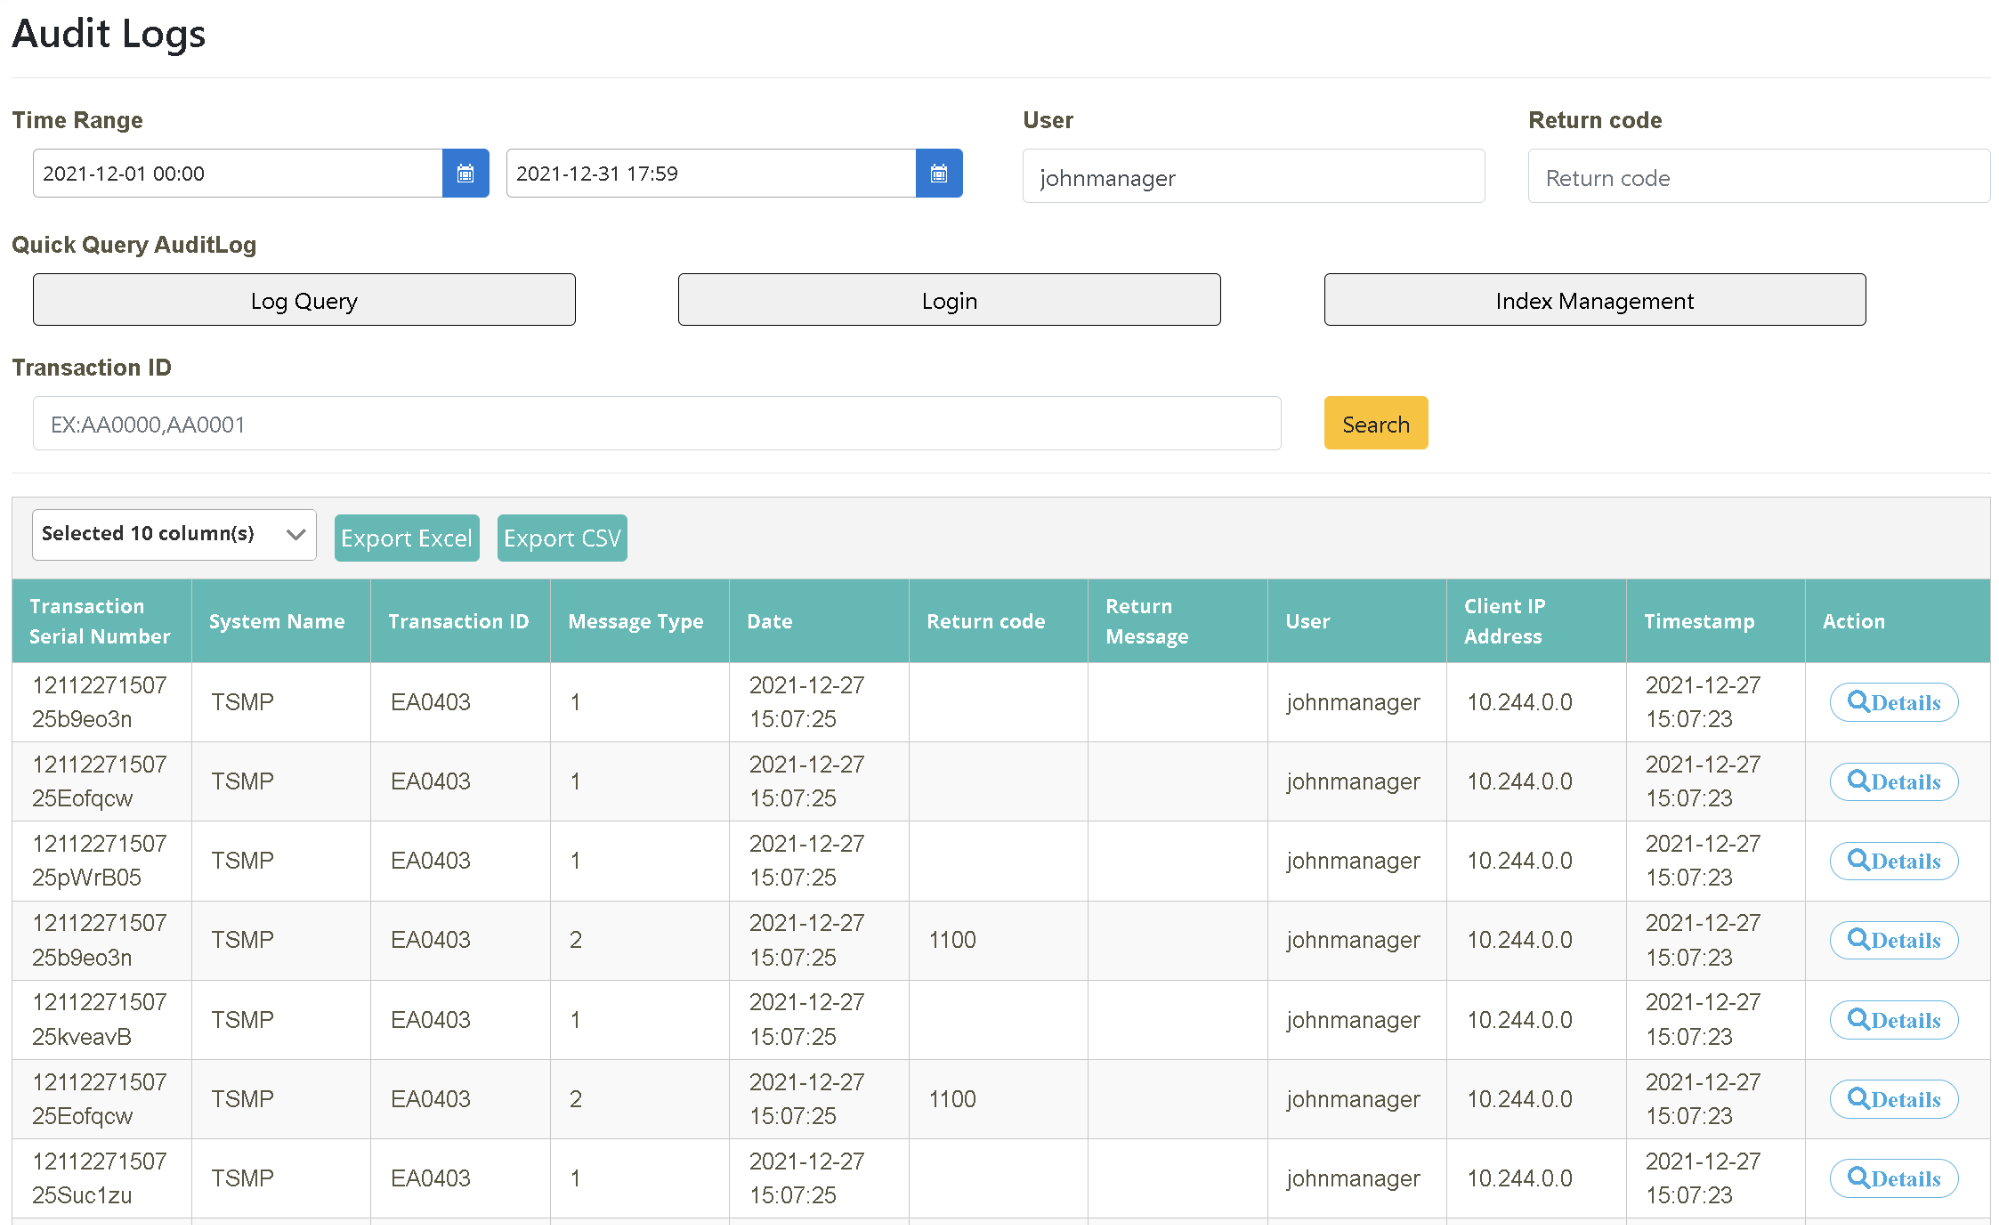
Click on “Monitoring Management” > “Audit Log” to select the starting and ending time (2021-12-01~2021-12-31) as the time interval to be searched. You can also search with additional criteria such as “User, Return Code, Transaction Code” (user=johnmanager). Click [Search] to obtain the behavior details of the person searched for.
MIS director Alex notices a situation where he is often notified of system anomalies unexpectedly and has to urgently dispatch developer Tony in his team to take care of it. Alex wants to improve the process. After digiLogs was introduced, he found that in addition to the default Server Node on the platform, he could set the alert using keyword mode, with alert criteria and designated contacts to meet the requirement. The designated contacts will receive a notification automatically when the same anomaly occurs in the future and they can work on the issues in digiLogs afterward.
(You can follow the steps on this page to do the setups If you already have alert settings to be created.)
The following is a brief explanation of the meanings of “Alert Settings” in the field on the page:
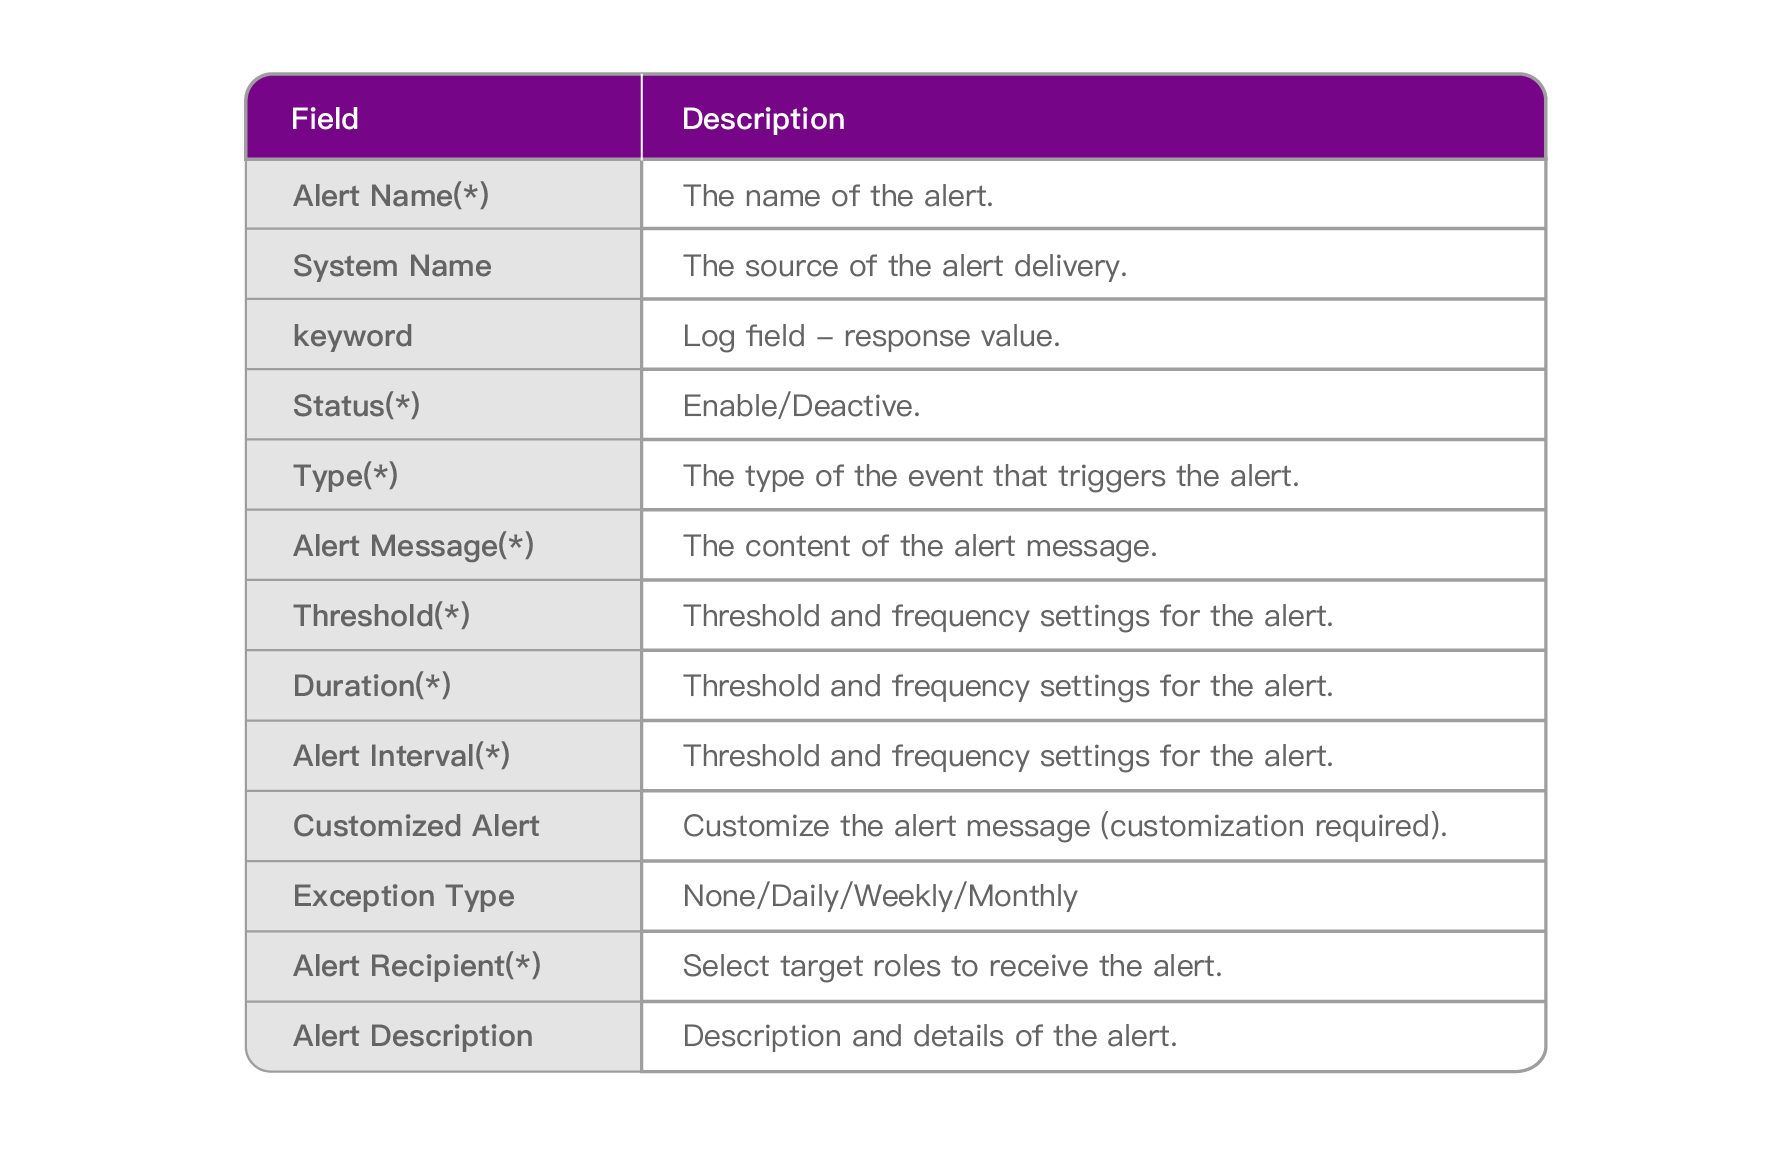
The following situations are anomalies reported by the users. After some investigation, it is suspected that unstable system operation status has caused unknown operation interruptions and failure. As a result, the end users couldn’t complete the operation process smoothly. Alert mechanisms need to be set for the reported anomalies in order to track and work on them in the future.
MIS developer Tony received anomaly reports from the users. After some investigation, the main issue identified was that unstable “scheduling” system operations caused operation failures. As a result, the end users couldn’t complete the operation process smoothly. Due to the recent frequent occurrence, he asked the Logs strategy team to include it on the alert notification list to monitor the situation.


Scenario Description: When “failure” occurs twice in a 30-second interval during scheduling, all the group members with Role: BU-Developer and BU-Manager will receive an alert notification.
Please follow the “Example Data” below to fill in the fields on the page, and then click [Create] to complete.
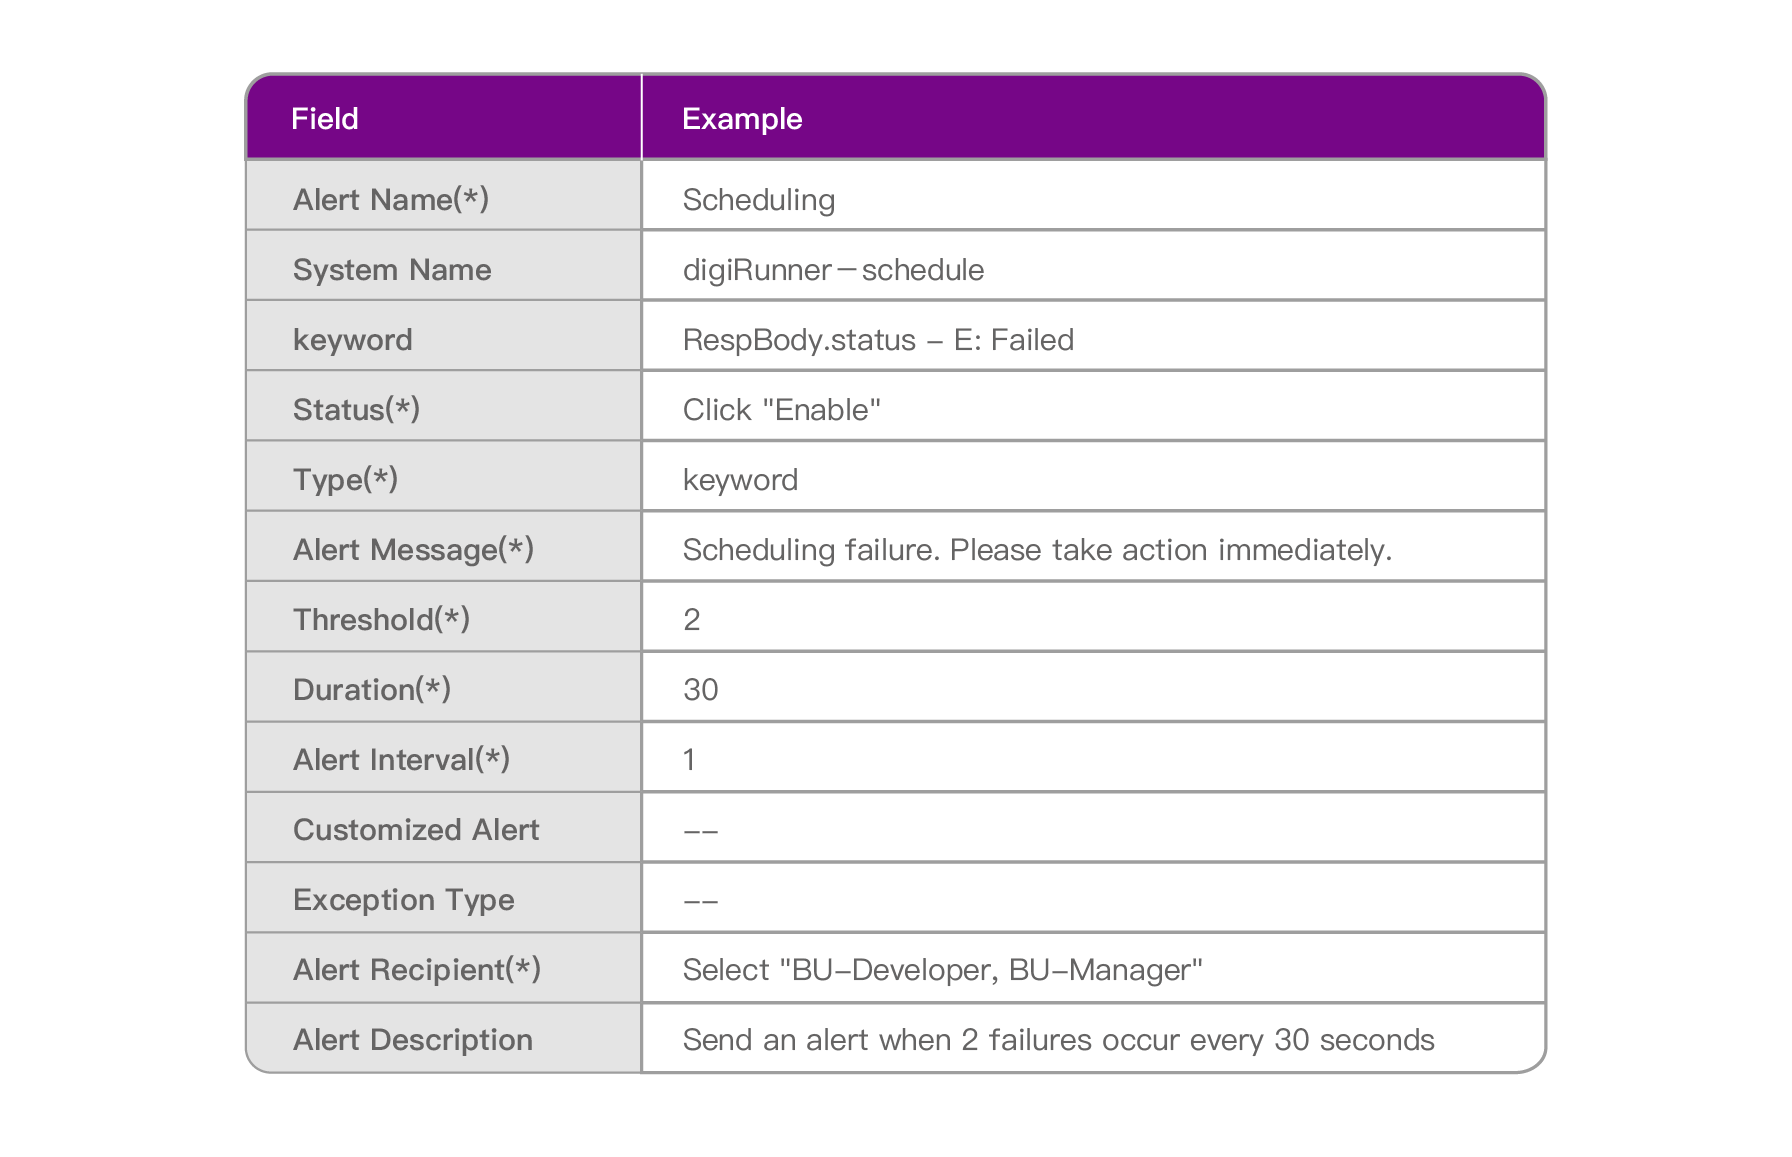
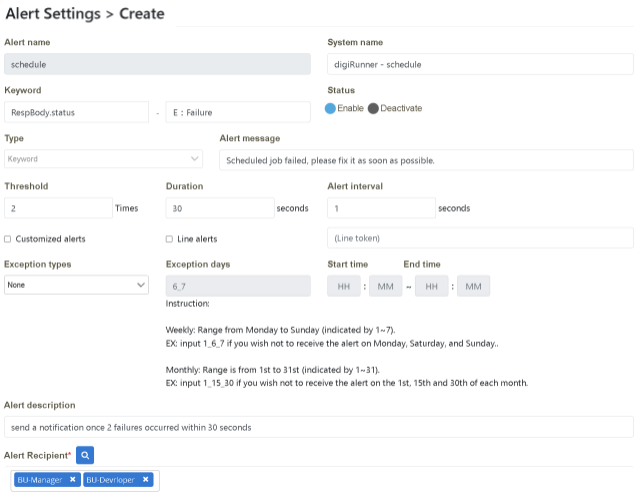
Verify that it is set up successfully.

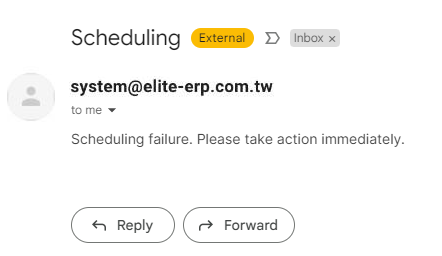
Anomaly Notification Letter

Click on “Monitoring Management” > “Alert Settings”. Click “Create

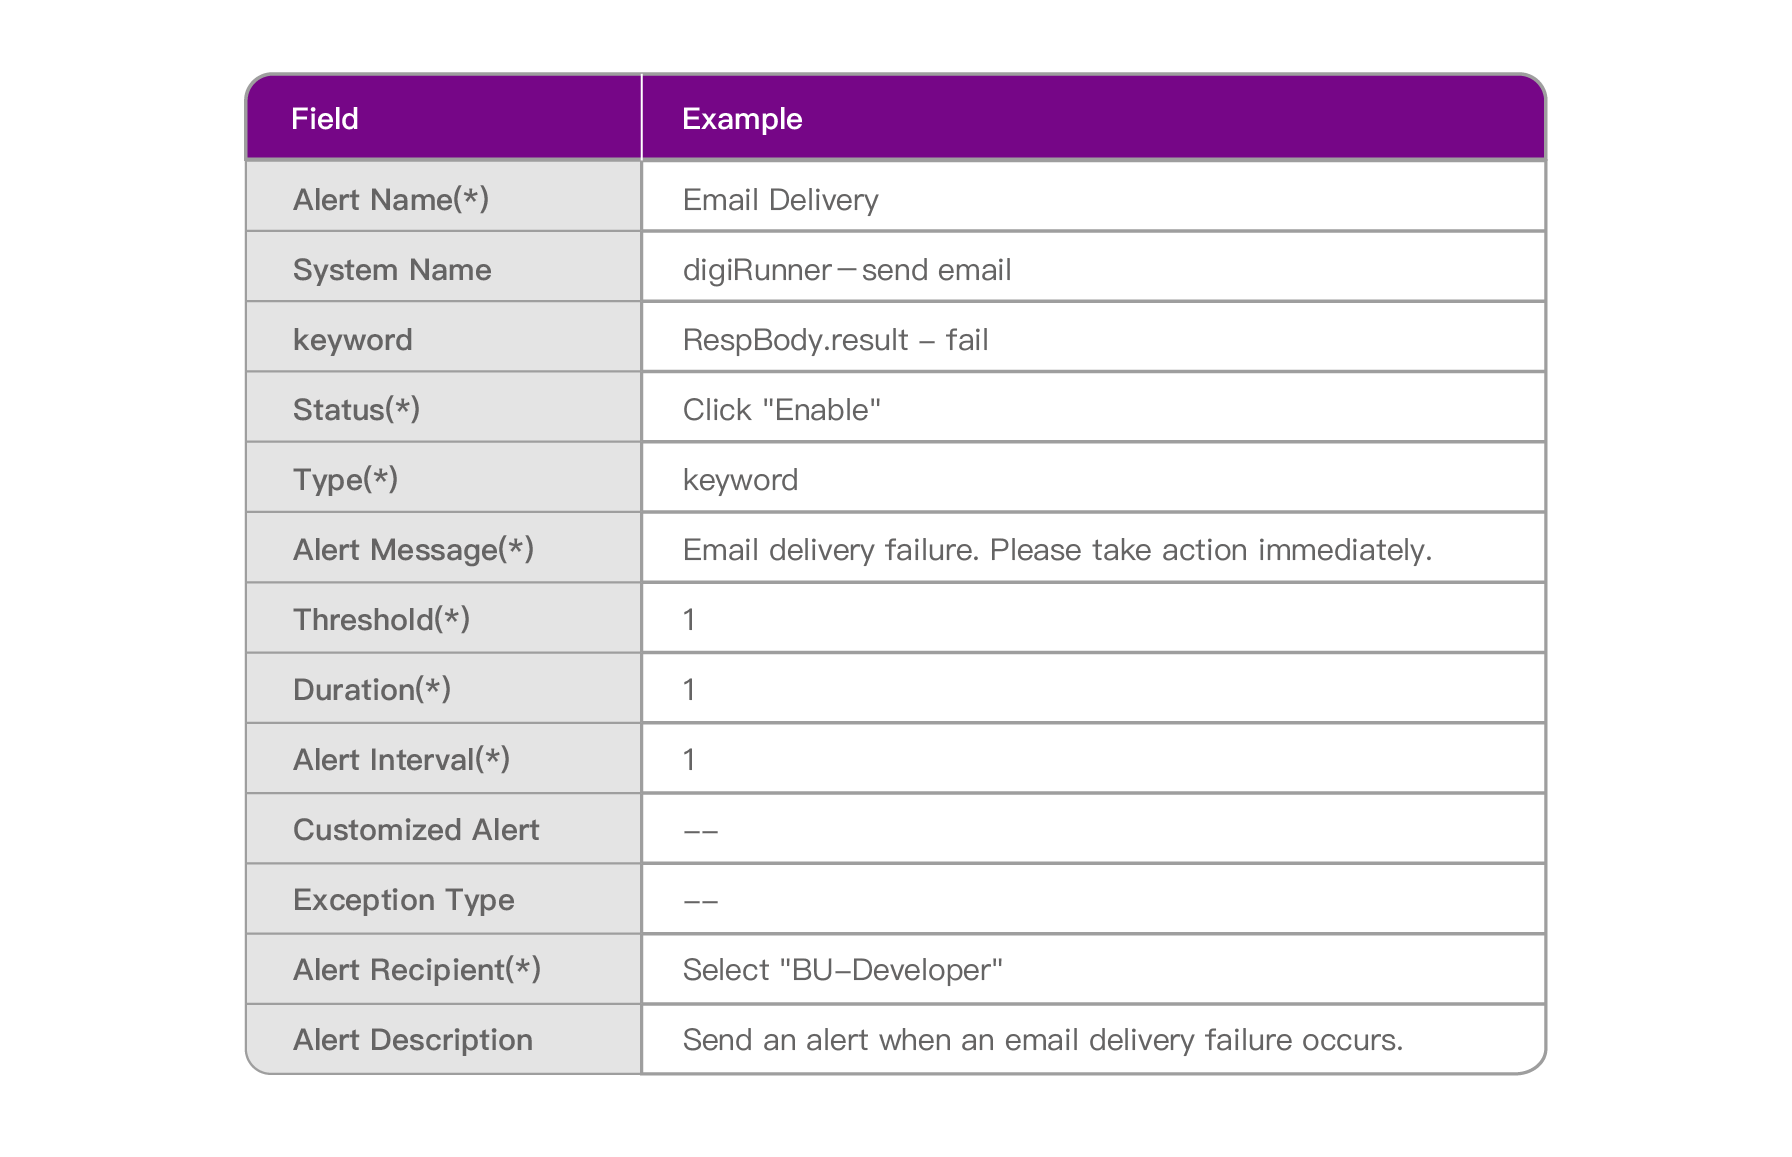
Scenario Description: When “failure” occurs once during the sending process, all the group members with Role: BU-Developer will receive an alert notification.
Please follow the “Example Data” below to fill in the fields on the page, and then click [Create] to complete.
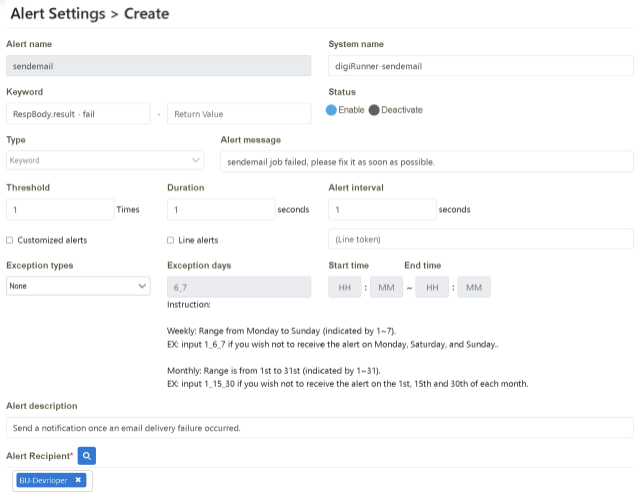
Verify that it is set up successfully.

Anomaly Notification Letter
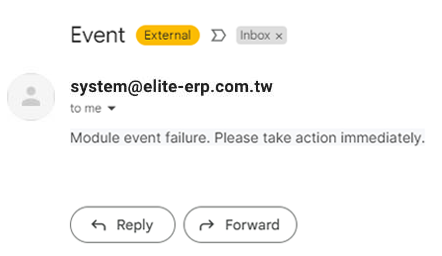
IT developer Joe had to monitor the operation status of individual models on the “API management platform (digiRunner)” manually every day mainly because the anomalies of modules make great impacts and his manager is very serious about it. When digiLogs was introduced, Joe wanted to turn from passive to active, so he decided to ask the Logs strategy team to add “Event Viewer” (results of all execution events) to the alert settings, which allows him to check on the system only when anomaly notifications are received.

Click on “Monitoring Management” > “Alert Settings”. Click “Create”.

Please follow the “Example Data” below to fill in the fields on the page, and then click [Create] to complete.
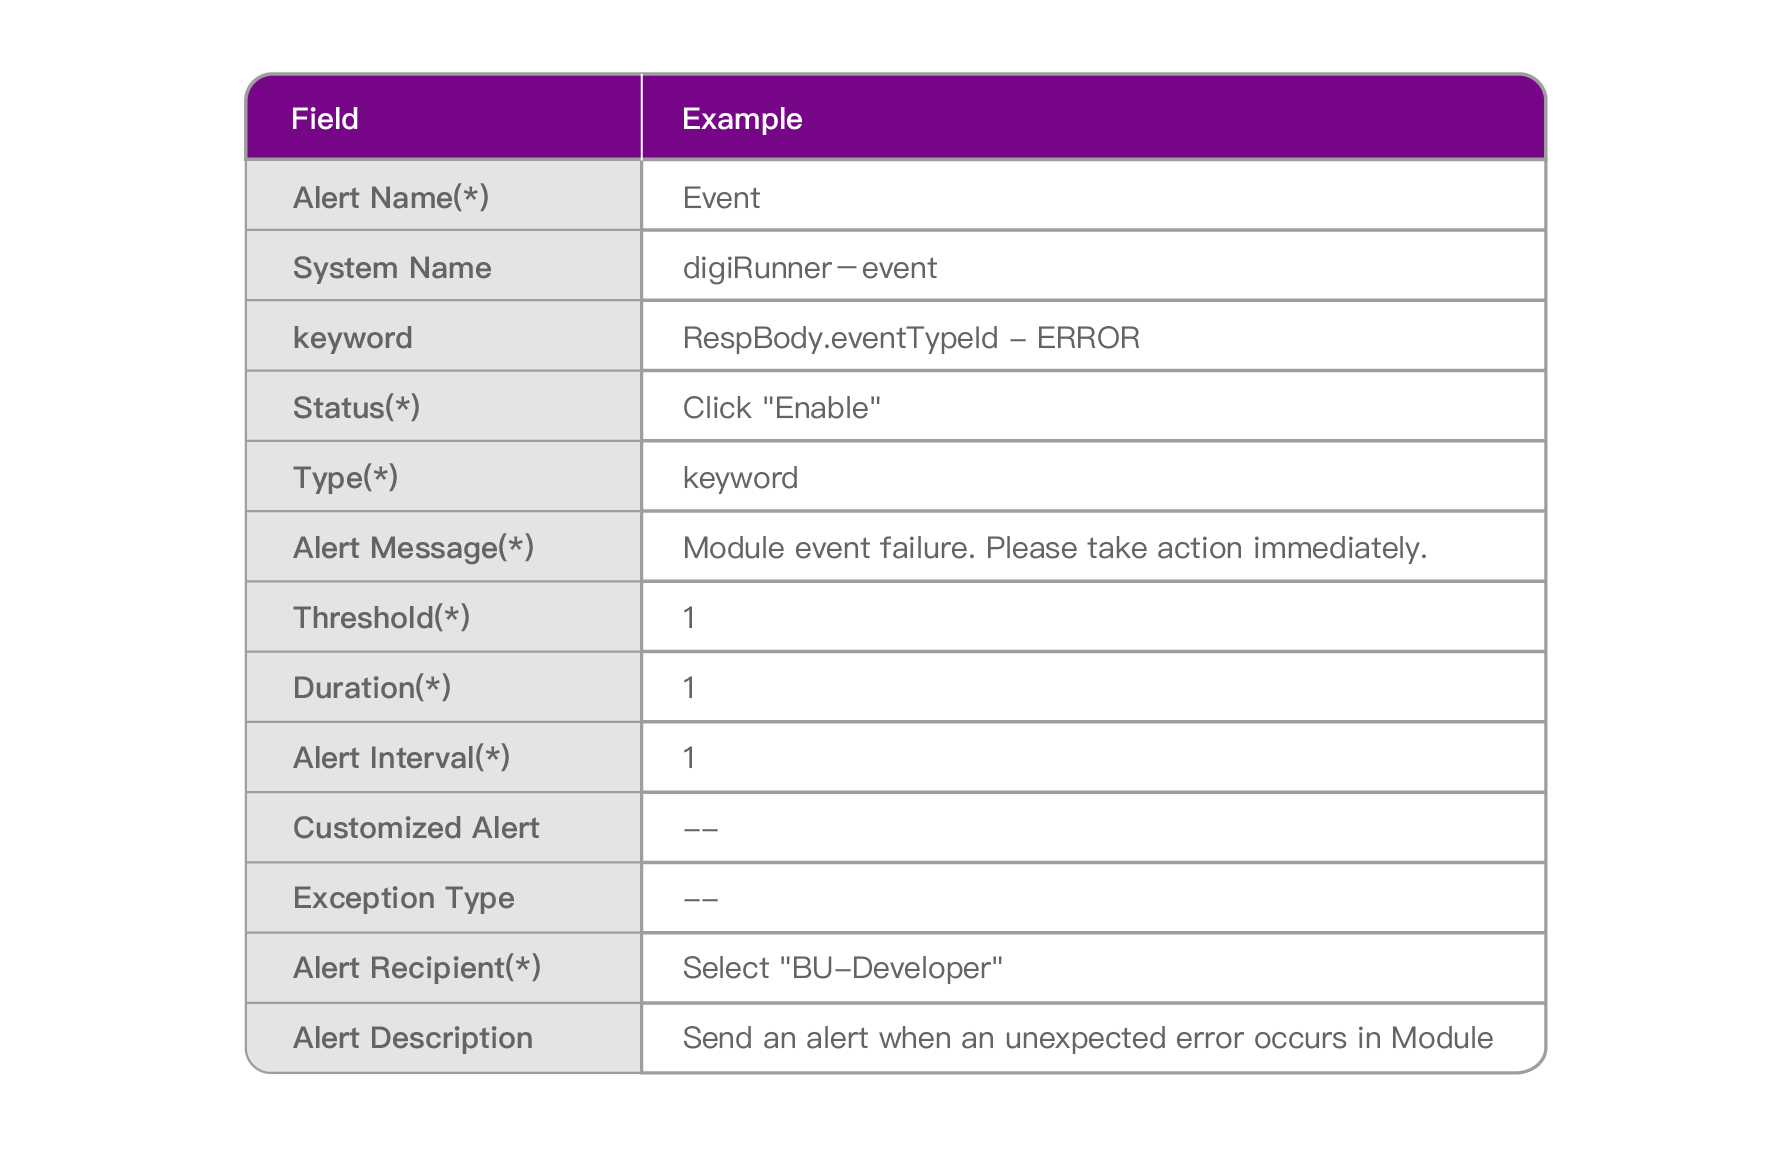
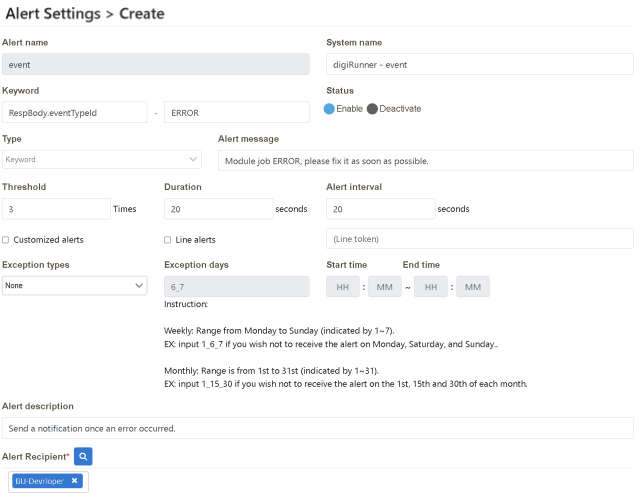
Verify that it is set up successfully

Anomaly Notification Letter

In this scenario, you can find out how digiLogs can help develop customized monitoring reports according to the enterprise requirements and use graphic reports to illustrate the operating status with a quick look as well as make simple analyses.
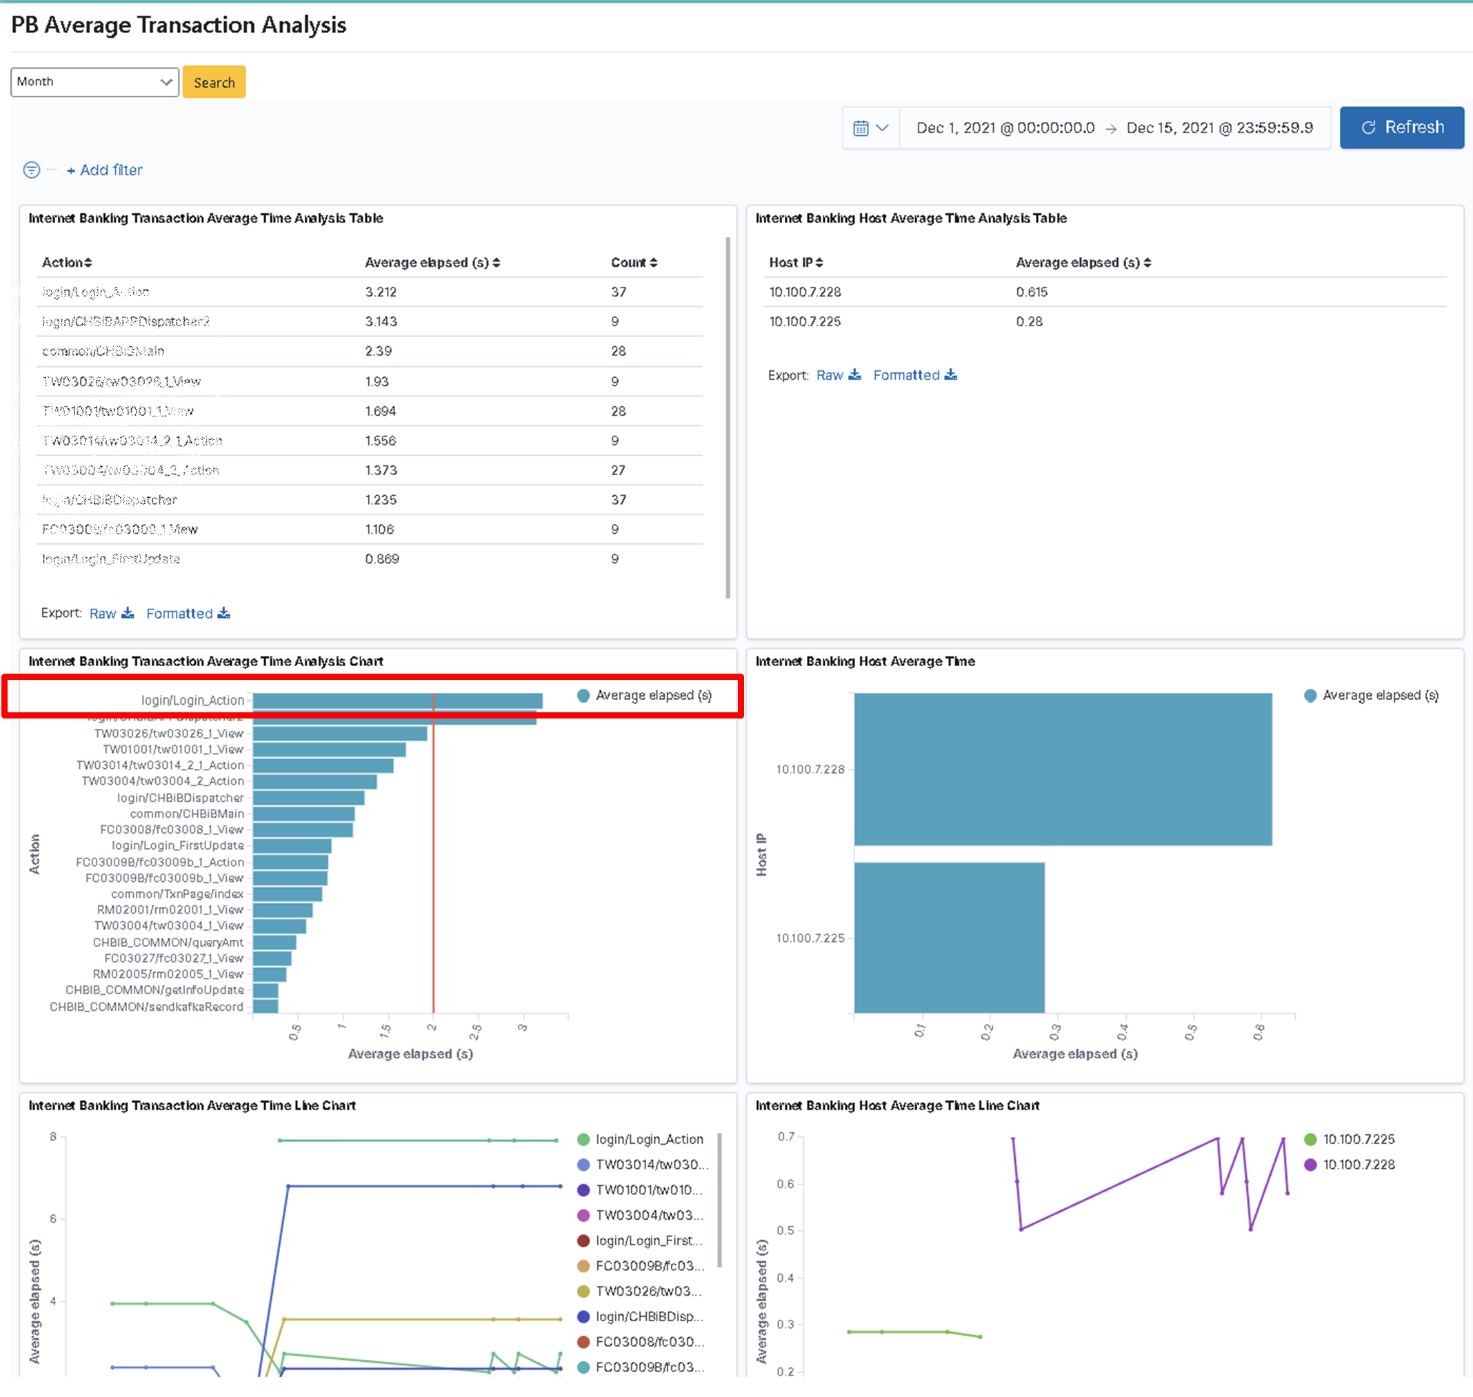
Bill believes that the dimension of concern for the “Cash Flow (Online Banking) System” is between system actions and hostname, and their correlation with time/counts. So he proposed a customization requirement to present the information of the system action with its average usage counts and time as well as the hostname logged into the system and its average duration in tabular format, bar graph, or line graph.

After logging in as Role: bu01_mgr, click on “Transaction Monitoring” > “Average Online Banking Transaction Time Analysis” to select the time interval (Month) to be searched, and click [Search].

After logging in as Role: bu01_mgr, click on “Transaction Monitoring” > “Average Online Banking Transaction Time Analysis” to select the time interval (Month) to be searched. Select the “Start Time (2021-12-01)” and “End Time (2021-12-15)” (using Absolute) in the function box on the right-hand side of the “Calendar” icon and click [Update].
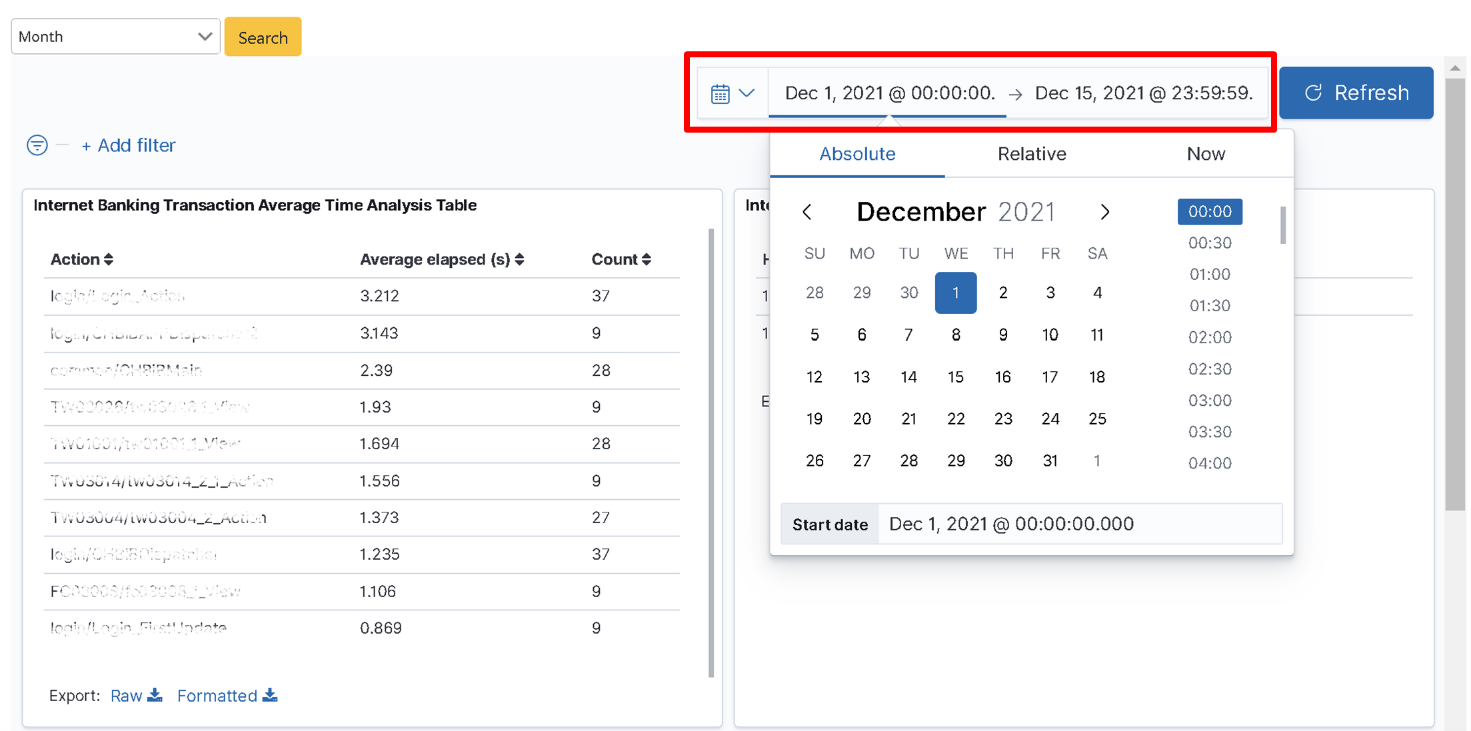
Pull down on “Search Result” to locate the target result. In the “Average Online Banking Transaction Time Analysis Table”, the first item has the longest average action time (6 sec), which is obviously exceeding the average time. This information can be used as a reference to evaluate whether the data is reasonable and whether corresponding improvements are needed.
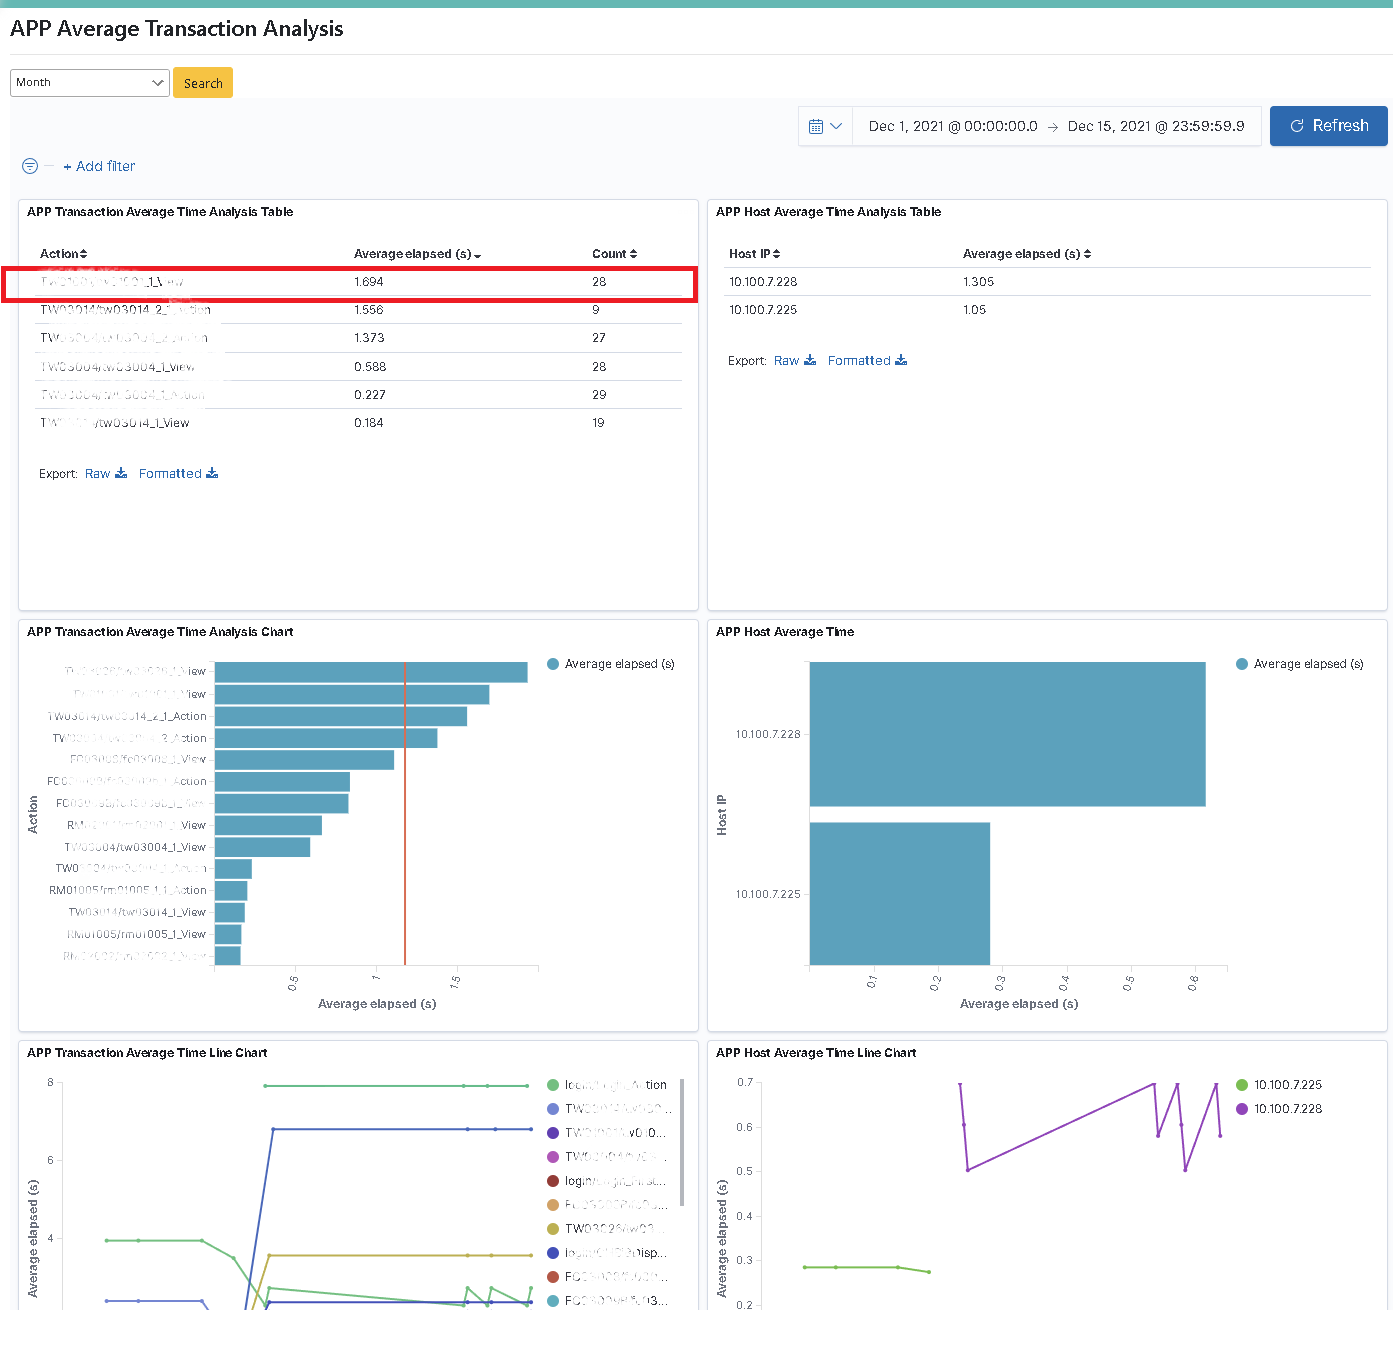
Bill sets the “App” dimension between system actions and hostname, and their correlation with time/counts. So the customization requirement is to present the information of the app action with its average usage counts and time, as well as the hostname logged into the app with its average duration in tabular format, bar graph, or line graph.

After logging in as Role: bu01_mgr, click on “Transaction Monitoring” > “Average APP Transaction Time Analysis” to select the time interval (Month) to be searched, and click [Search].

Click on “Transaction Monitoring” > “Average APP Transaction Time Analysis” to select the time interval (Month) to be searched. Select the “Start Time (2021-12-01)” and “End Time (2021-12-15)” (using Absolute) in the function box on the right-hand side of the “Calendar” icon and click [Update].
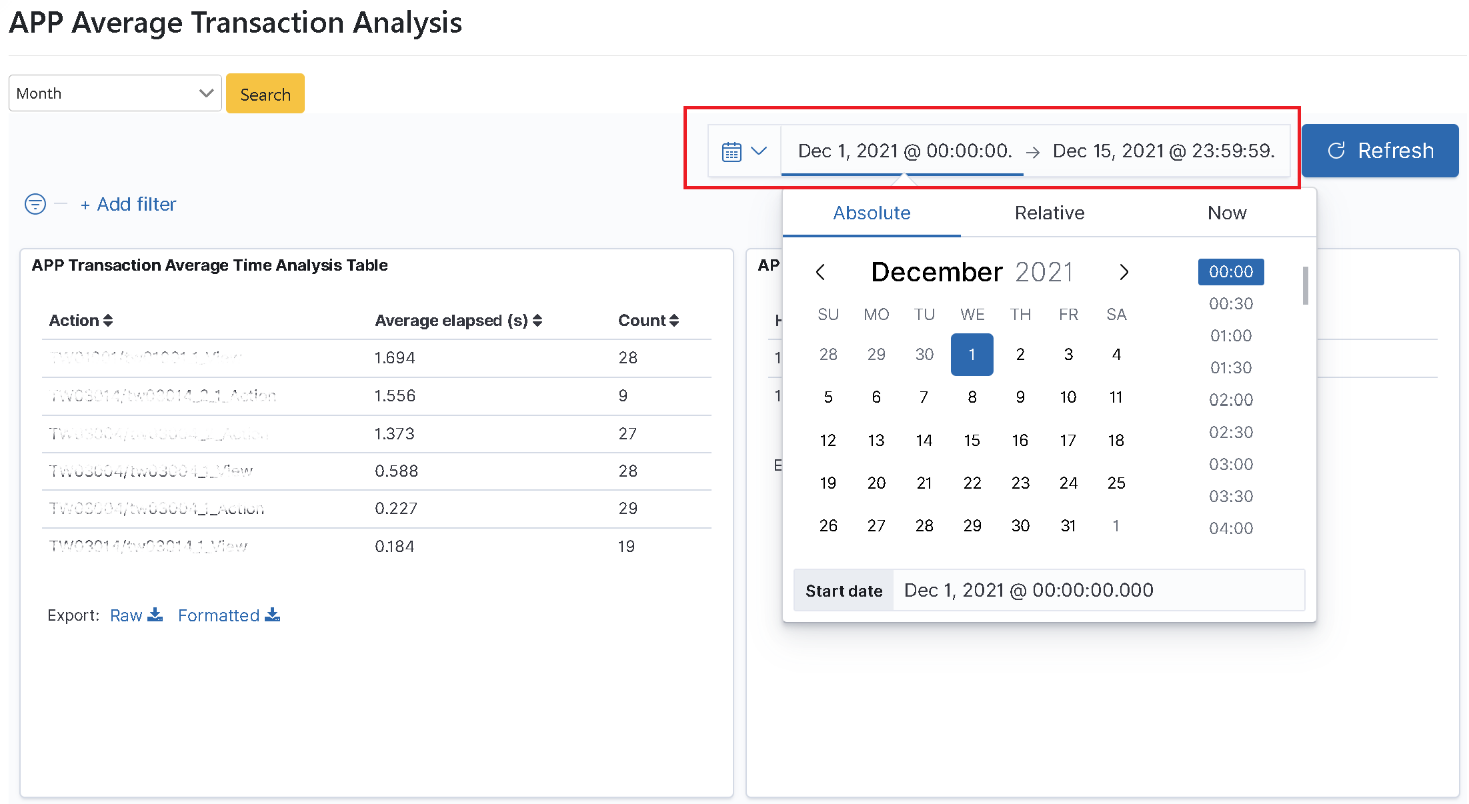
Pull down on “Search Result” to locate the target result. In the “Average APP Transaction Time Analysis Table”, the first item has the longest average action time (2 sec). This information can be used as a reference to evaluate whether the data is reasonable and whether corresponding improvements are needed.
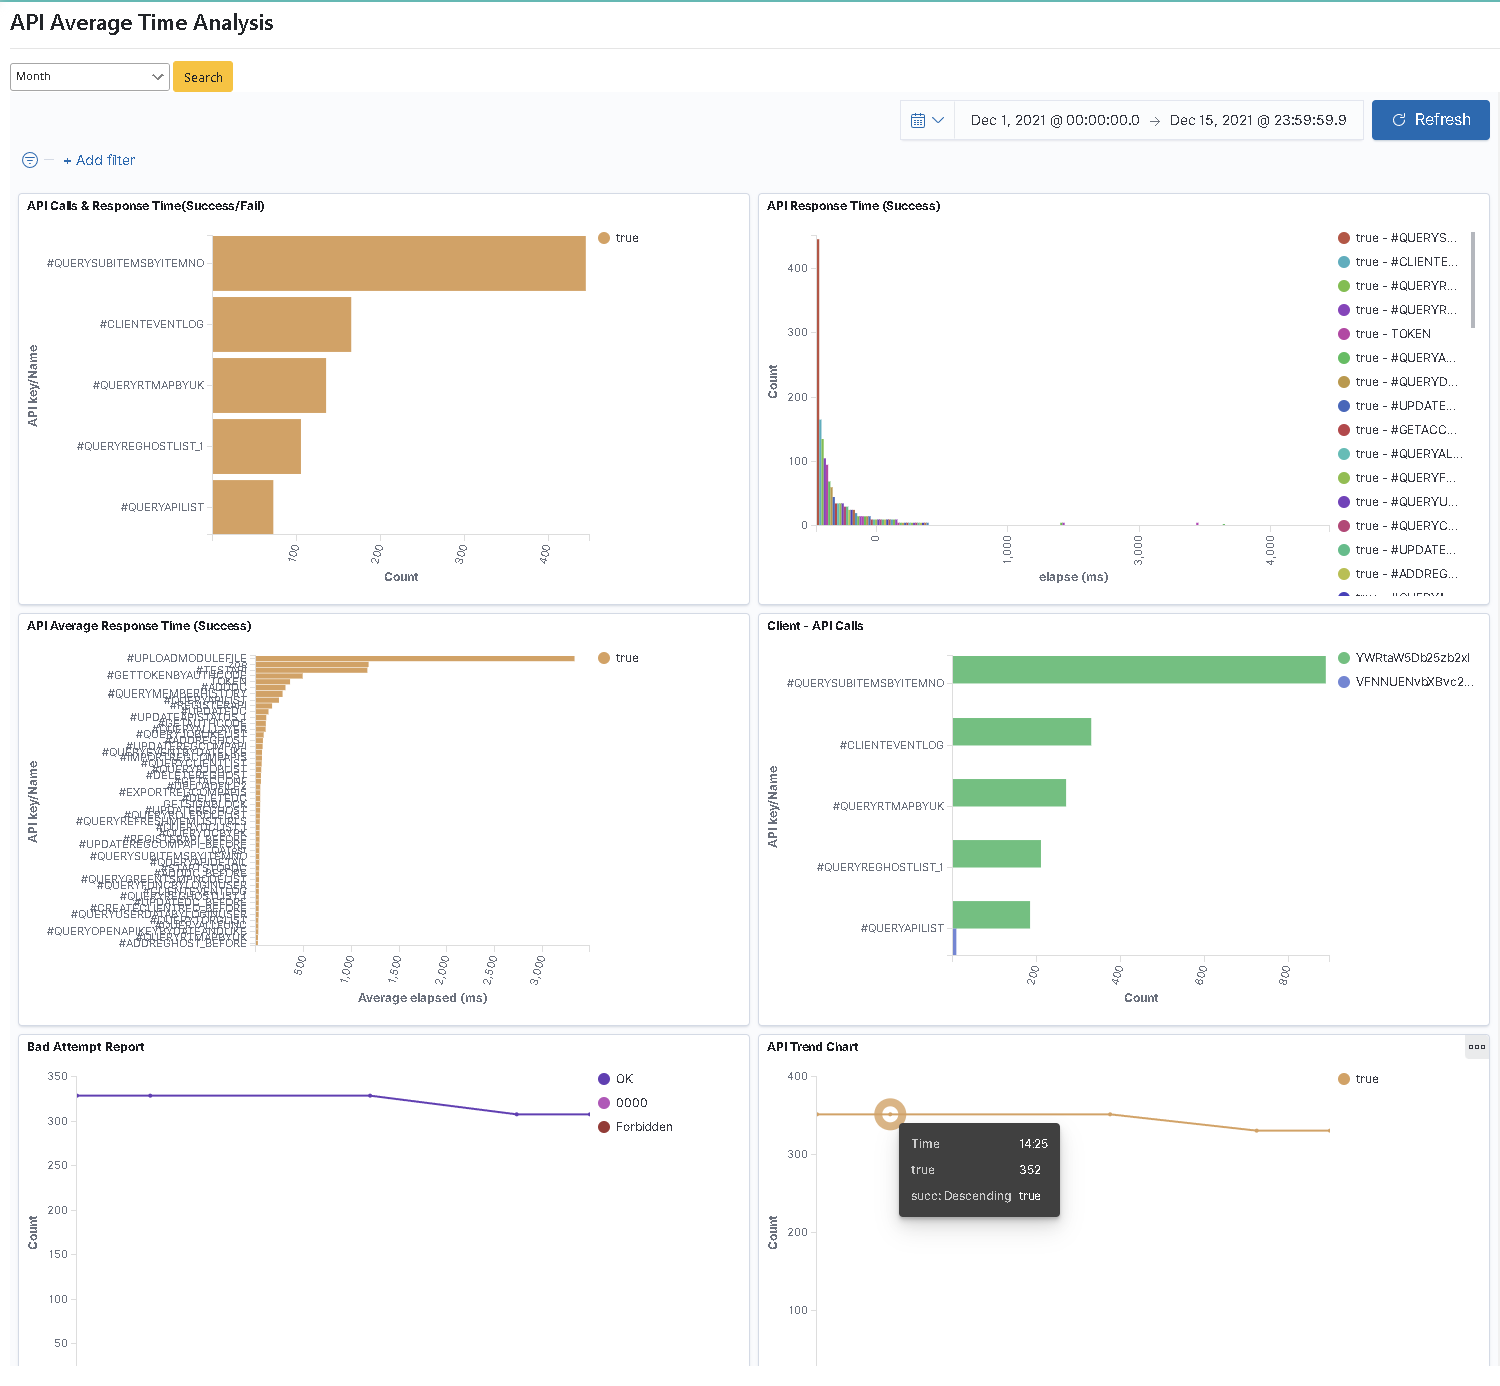
With the recently launched “API Management System”, Bill hopes to present the complete information of Traffic Analysis, Response Time (Max/Min), Usage Counts (Success/Failure respectively), API Counts – Time Analysis (Success only), average API time (Success only), Client-API Usage Counts, Bad Attempt connection report in tabular format, bar graph, or line graph.

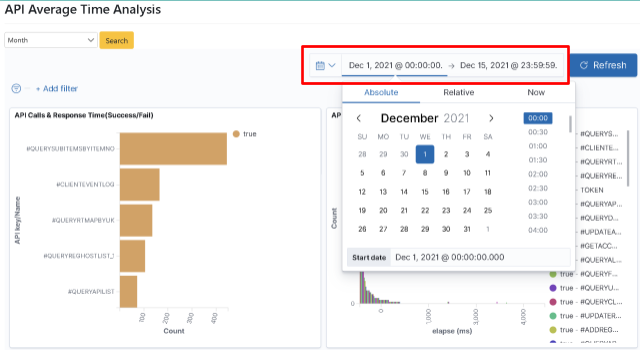
After logging in as Role: bu01_mgr, click on “Transaction Monitoring” > “Average API Time Calculation Analysis” to select the time interval (Month) to be searched, and click [Search].

Click on “Transaction Monitoring” > “Average API Time Calculation Analysis” to select the “Start Time (2021-12-01)” and “End Time (2021-12-15)” (using Absolute) in the function box on the right-hand side of the “Calendar” icon and click [Update].
In table “7. TSMP API traffic analysis”, the peak value of API traffic in this time interval is “15:46” with 50 hits. This information can be used as a reference to evaluate whether the data is reasonable and whether corresponding improvements are needed.
In this scenario, you can find out how digiLogs can help enterprises accomplish Log path mapping, customize the connection of monitoring systems, and present it in a one-page graphic manner so that you can learn about the system anomalies quickly and the methods to contact the party concerned.
IT director Bill finds a correlation between the subsystems of online banks. If the Logs of the subsystems can be integrated and connected, it will be faster and clearer to discover the issues before appropriate handling can be taken when system anomalies occur in the future. In this regard, digiLogs helped their department develop path mapping so that the subsystems can be connected and integrated according to their correlation, and presented in a “one-page web page” format so that the monitoring personnel can quickly check on the operation status between systems in real-time.

Click on “Transaction Path Mapping” to see if data in each system operate normally.
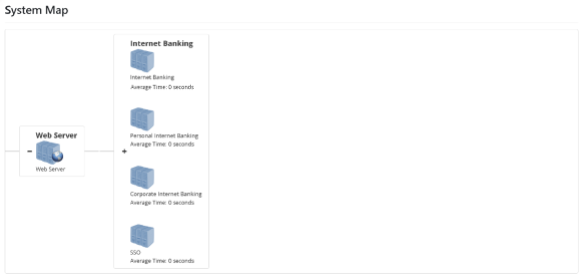
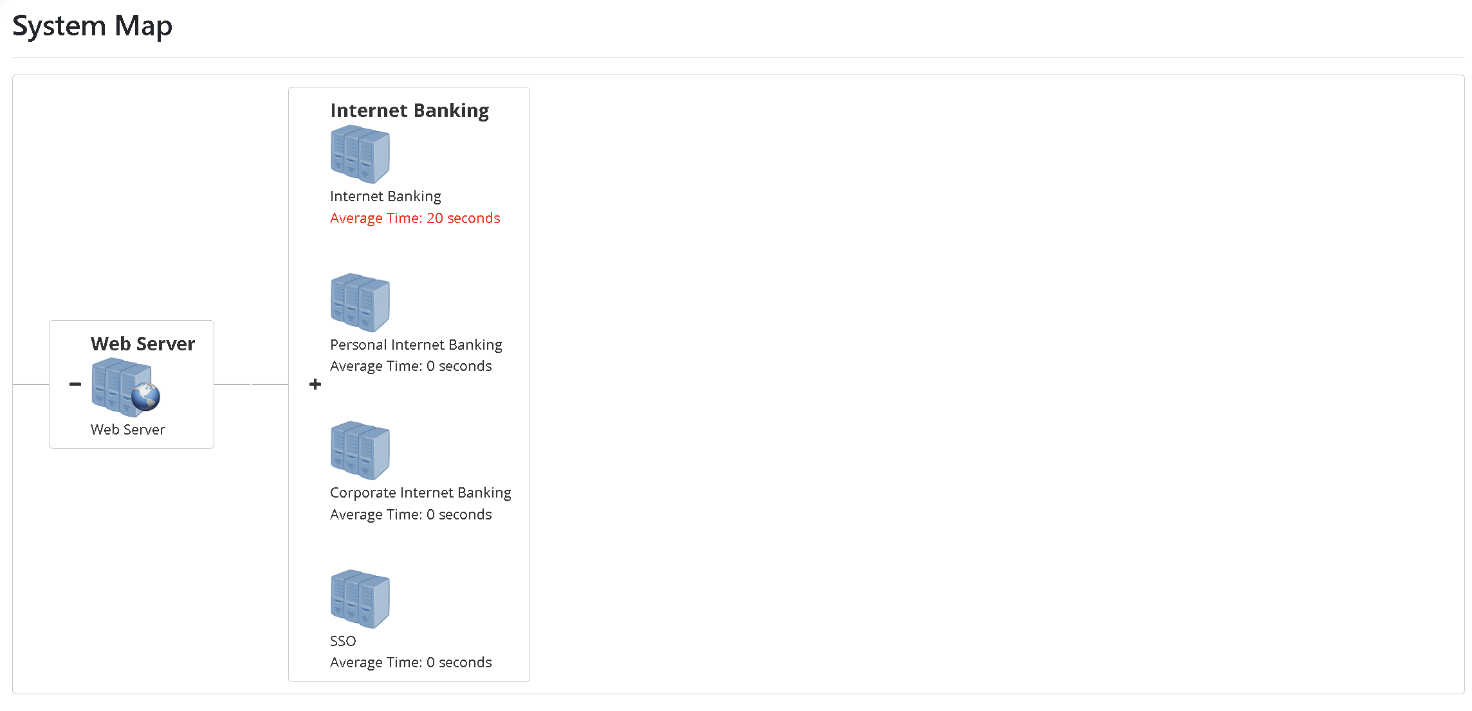
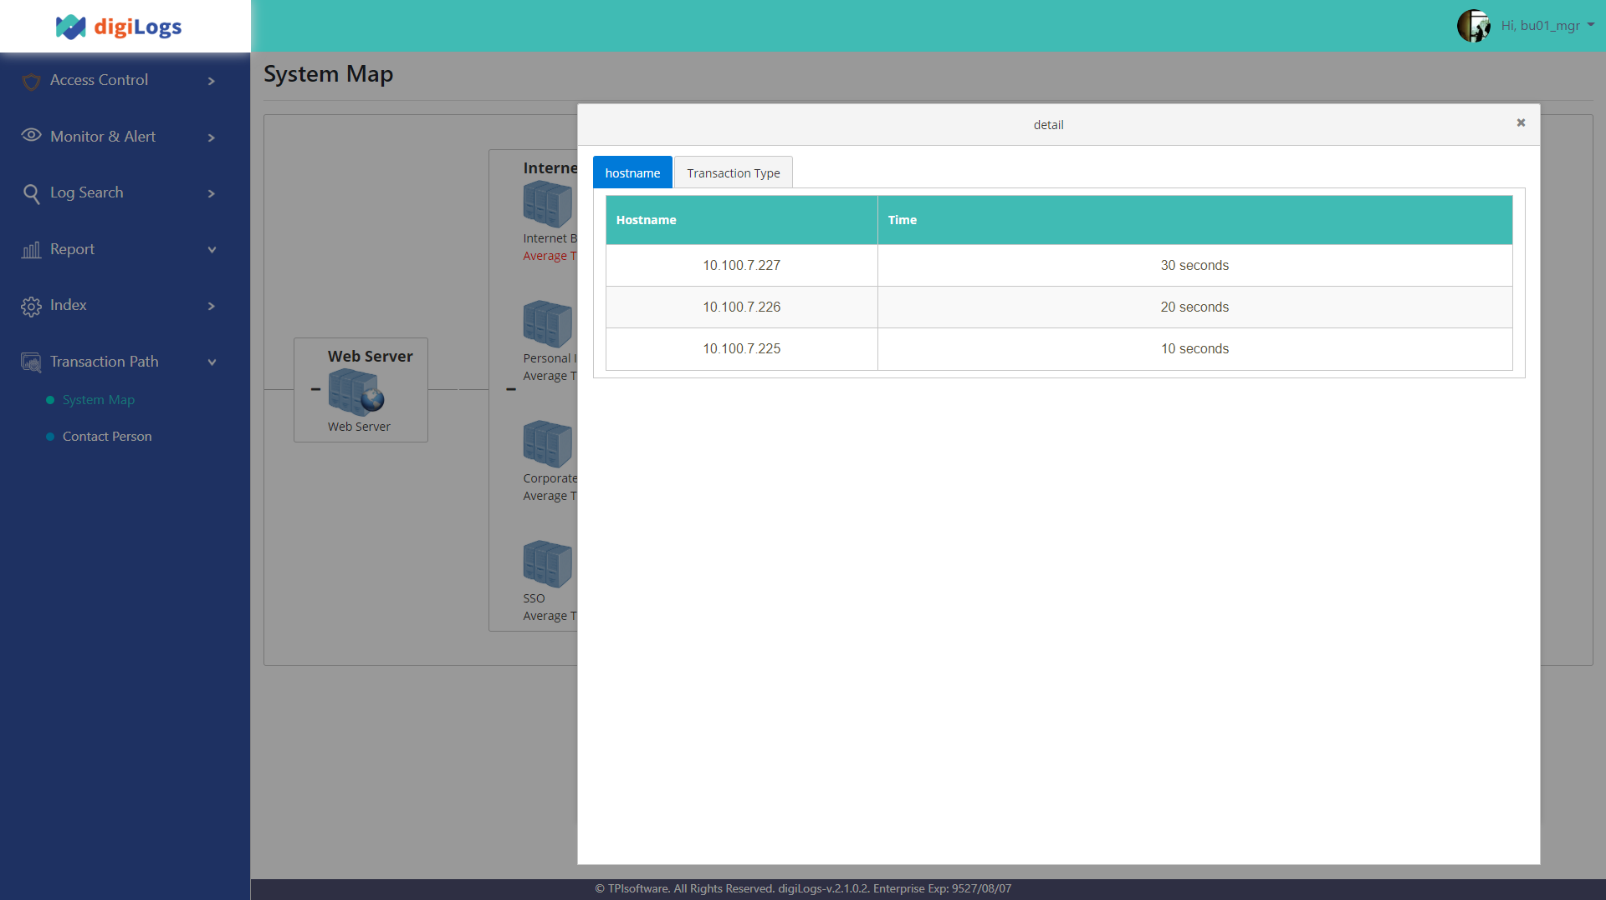
Click on the “average time” of the system in question to confirm its “System Type” and “Transaction Type” status.
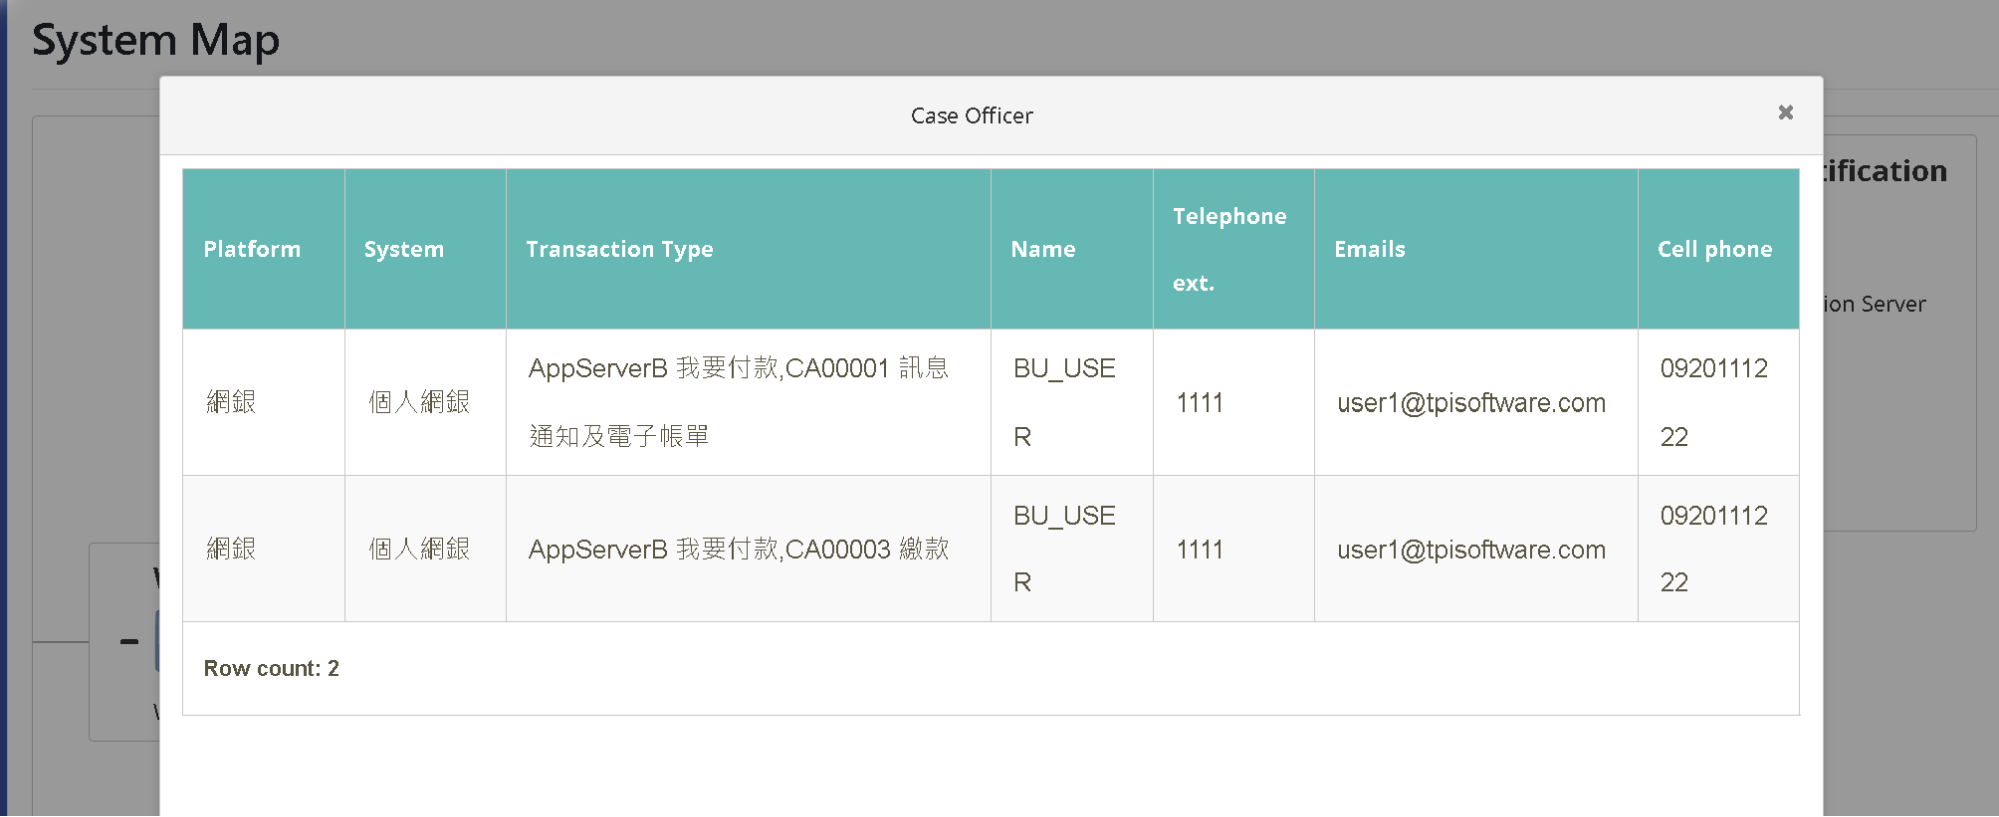
Click on the “icon” of the system in question to see the contact information of the responsible person.
In this scenario, you can find out how digiLogs uses the “Dynamic Query Field” to find the target Log data accurately.

(If you already have the criteria for log query, you can also follow the steps on this page to set them up)
After logging in as bu02_dev, click on “Log Query” > “Log Query” to select the starting and ending time (2021/12/27~2021/12/31). Select the data source to be searched (Index= dgr_sit_api_log_*) and click [Search].
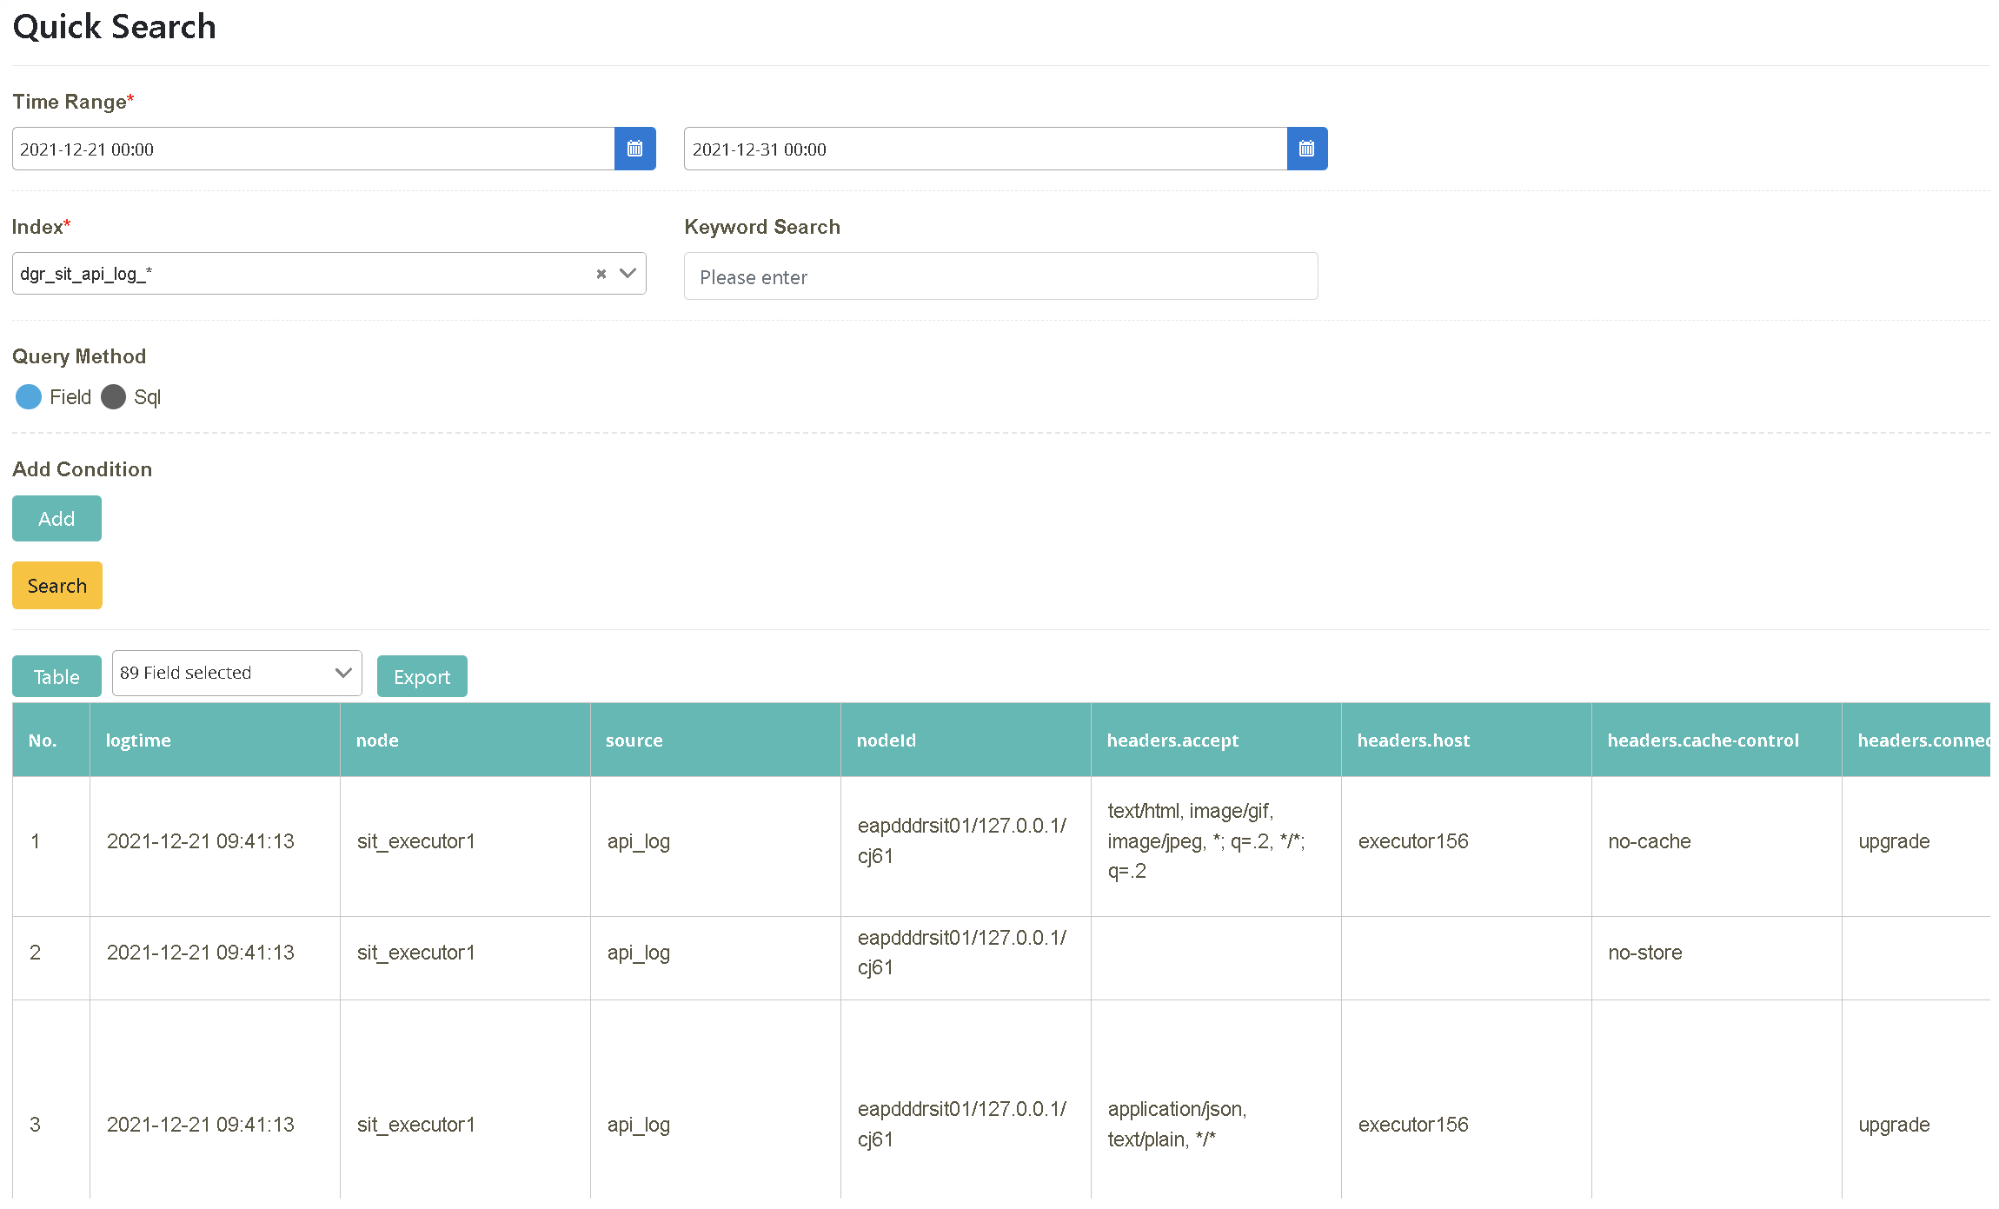
Following the previous step, enter “rtnCode” in “Keyword Query” and click [Search]. Check “No., cid, ResHeader.rtn, CodeResHeader.rtnMsg, mbody” in the field.
(ps: When entering a keyword, ” must be added before and after the string. For example: “test”.)
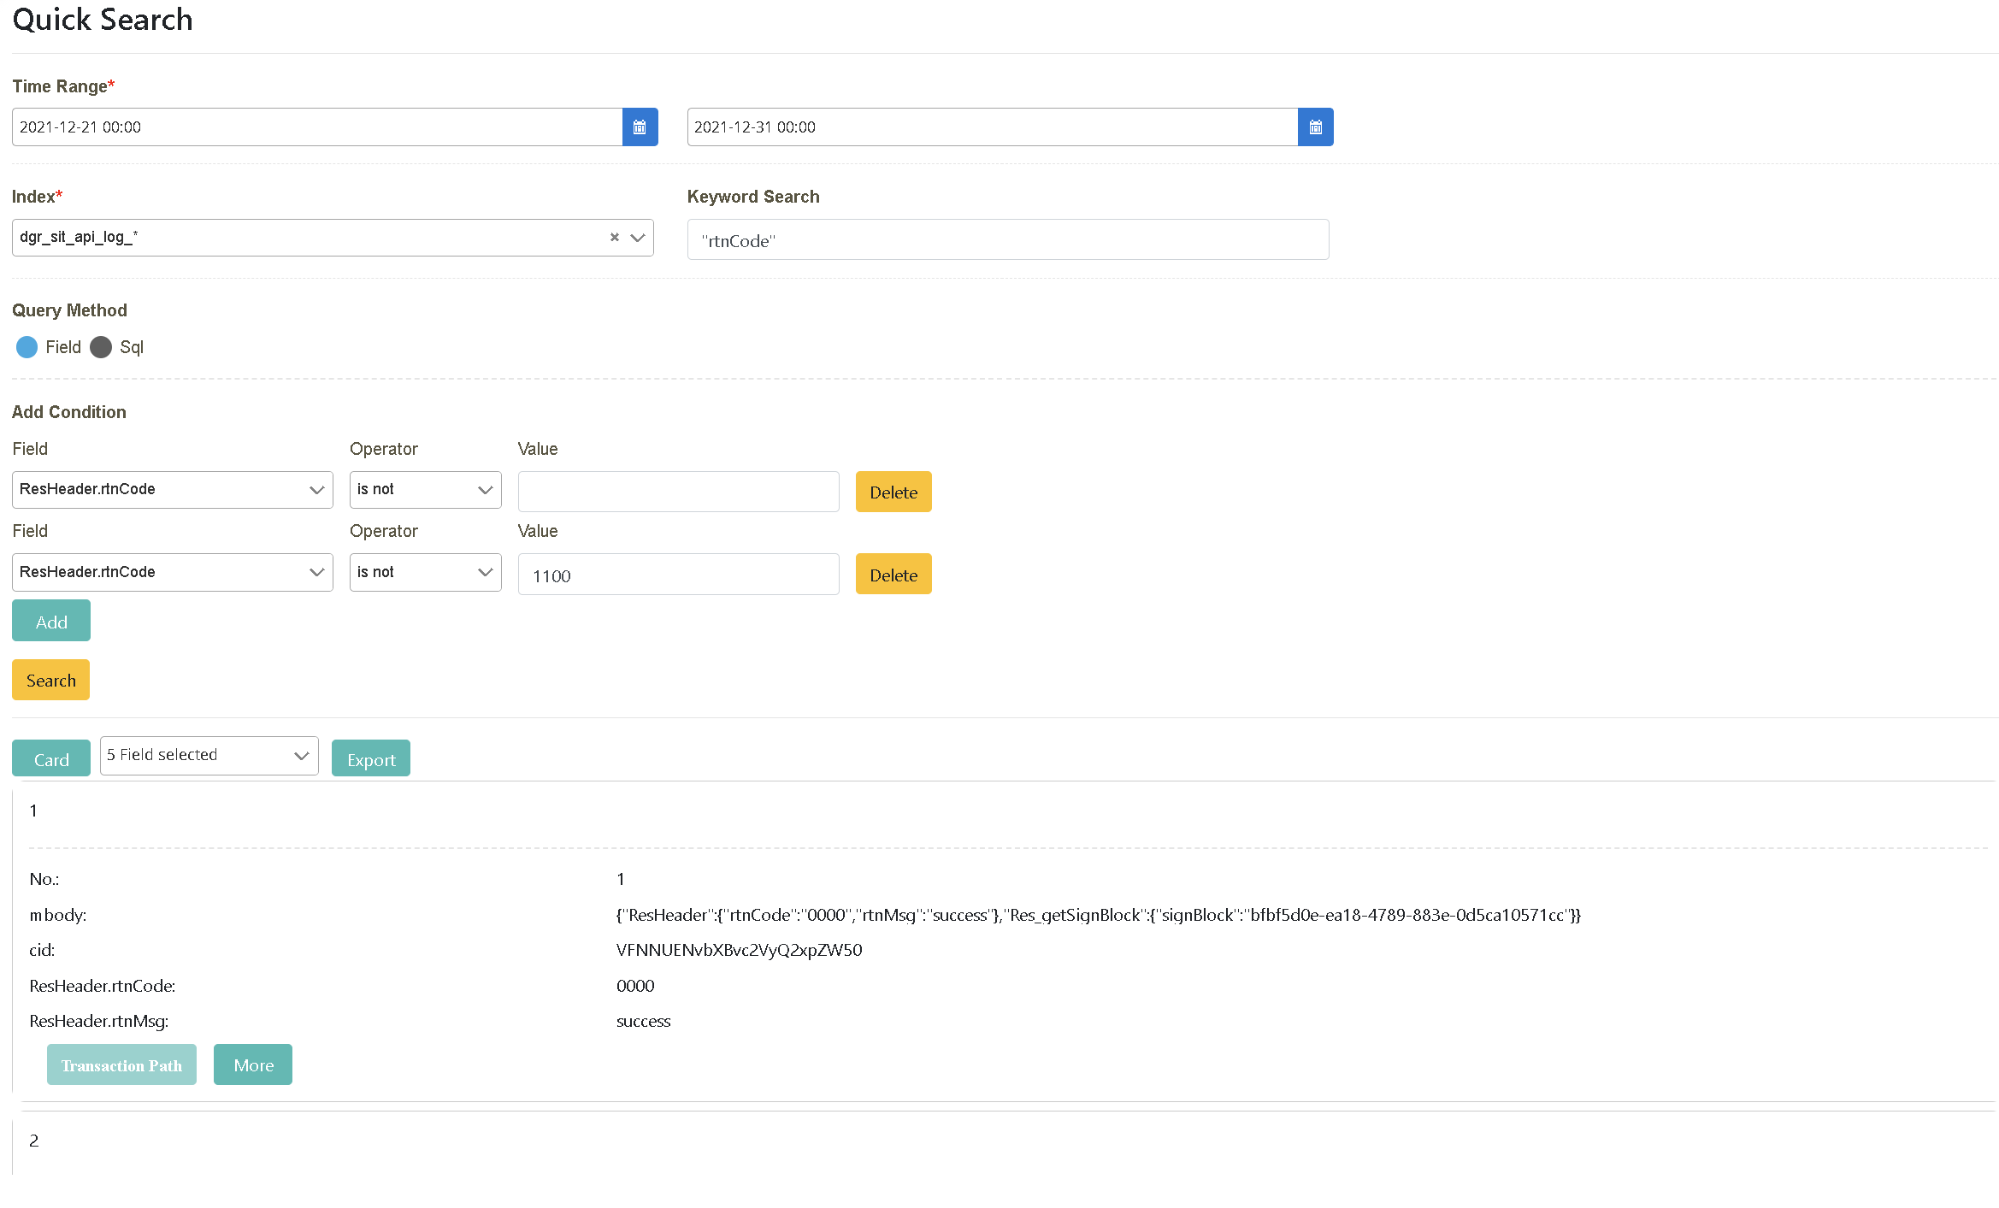
Following the previous step, click “Add” in “Add A New Query By Field Criteria”.
Pull down and select “Field” = ‘ResHeader.rtnCode’, “Operator” = ‘is not’, “Value” = ‘1100’ and “Field” = ‘ResHeader.rtnCode’, “Operator” = ‘is not’, “Value” = blank. Click [Search] to complete the data search.
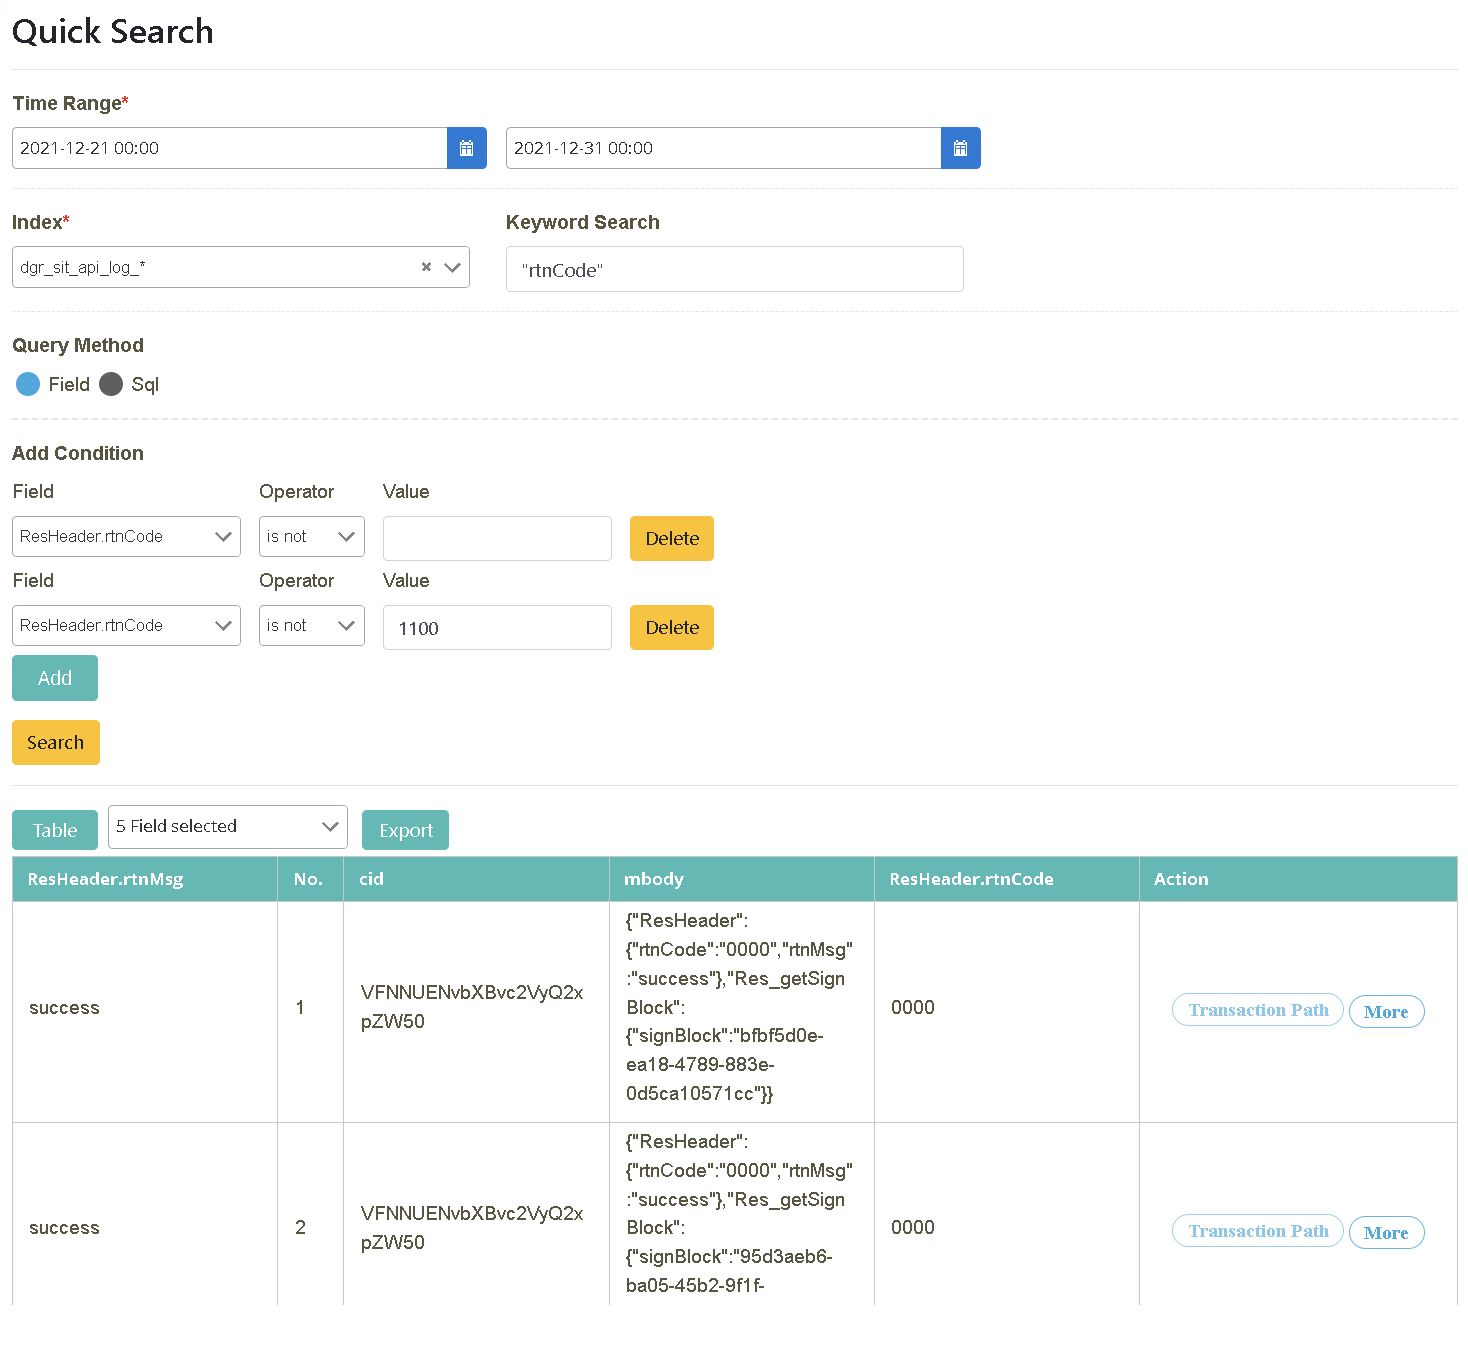
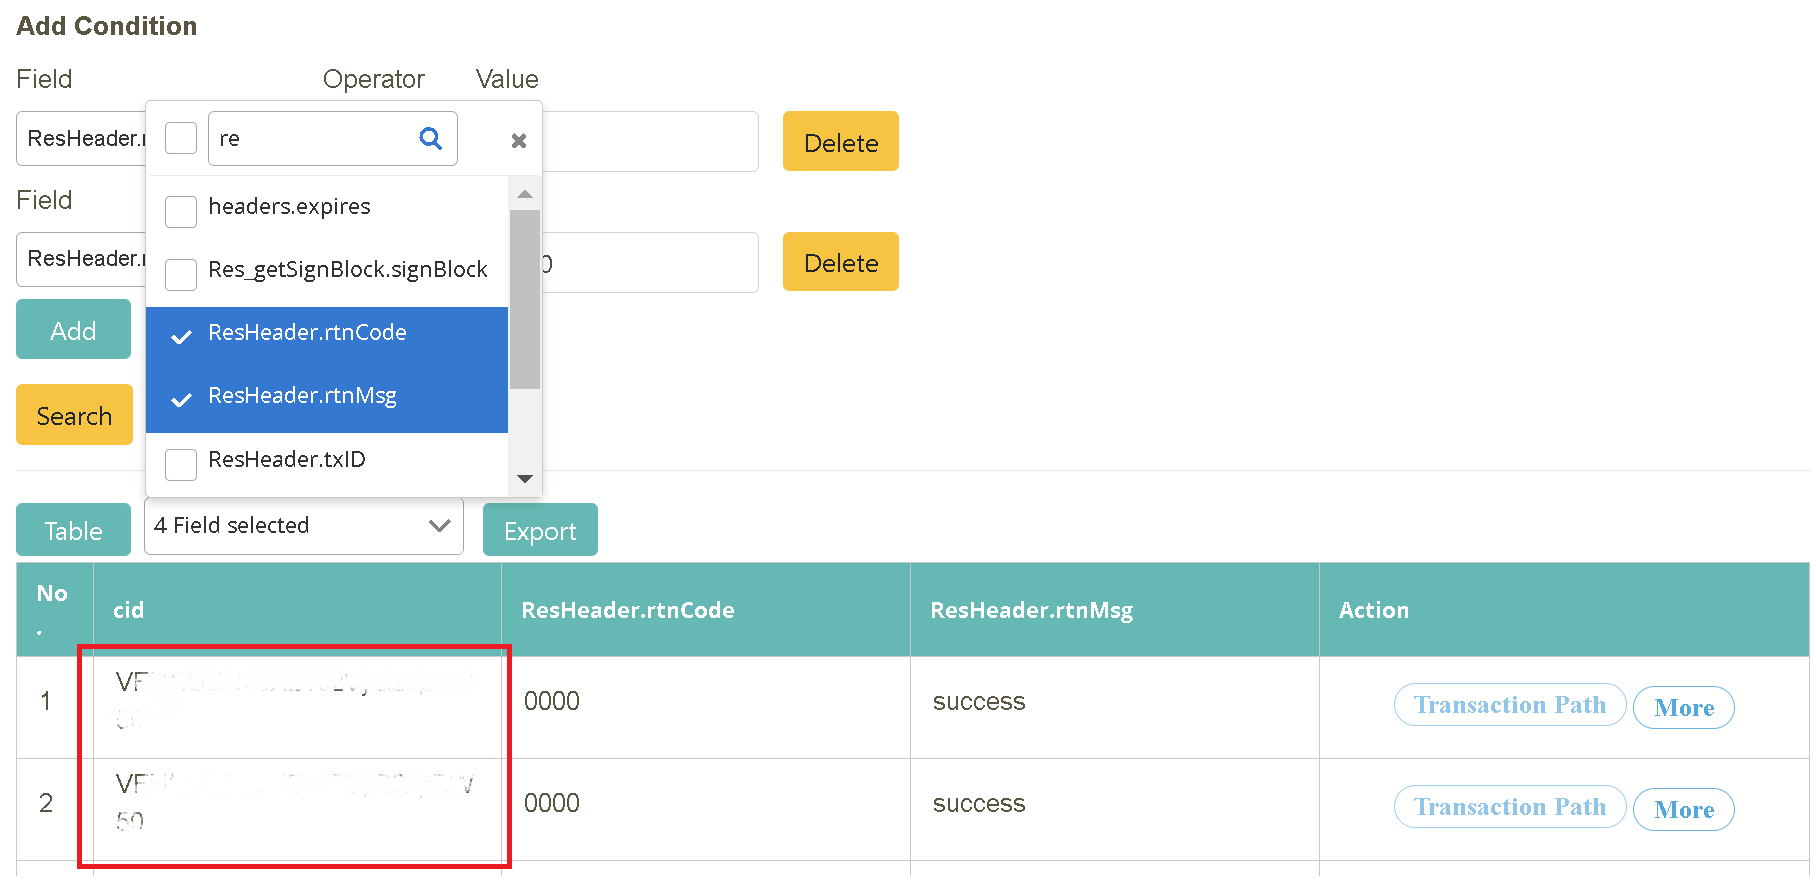
Following the search result from the previous step, select the field content to be displayed in the info field (located between “Table” and “Export”). You can also export the data (.xlsx). Check “No., cid, ResHeader.rtnCode, ResHeader.rtnMsg, mbody” in the field.

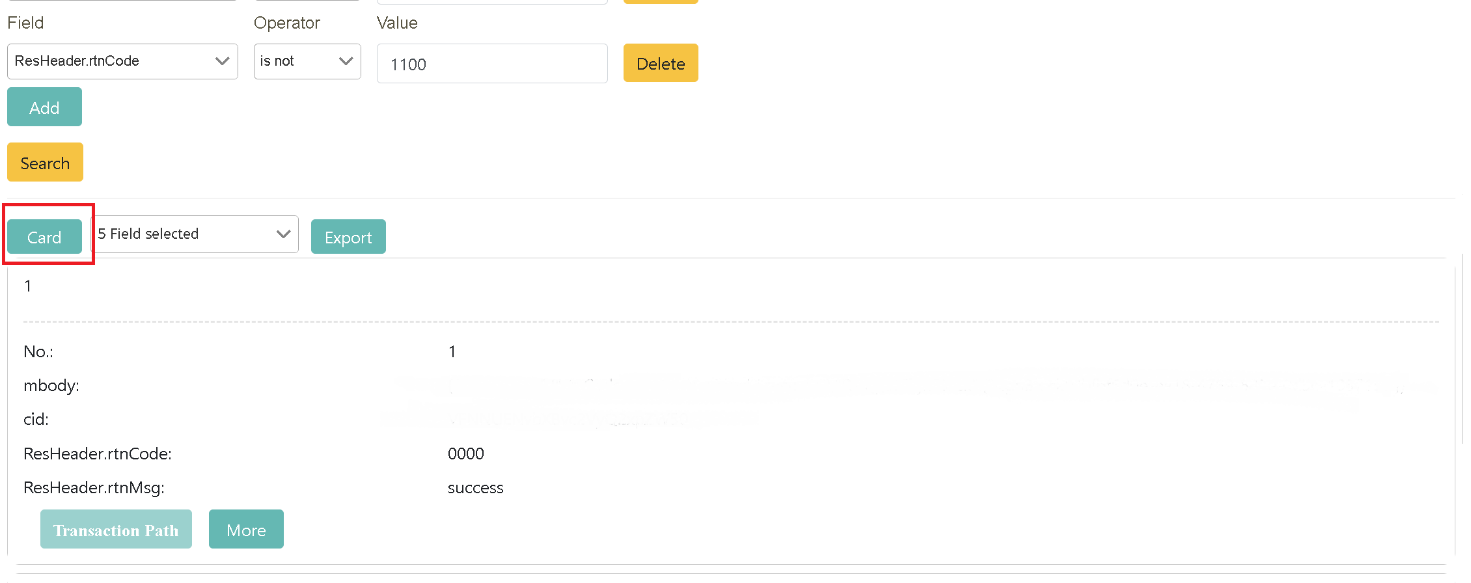
Display switch (tabular/card format)

In this scenario, you can find out how digiLogs finds clues of correlation with other data sources through “Associate Query” and learn about Log transaction information passing through the systems according to its context.

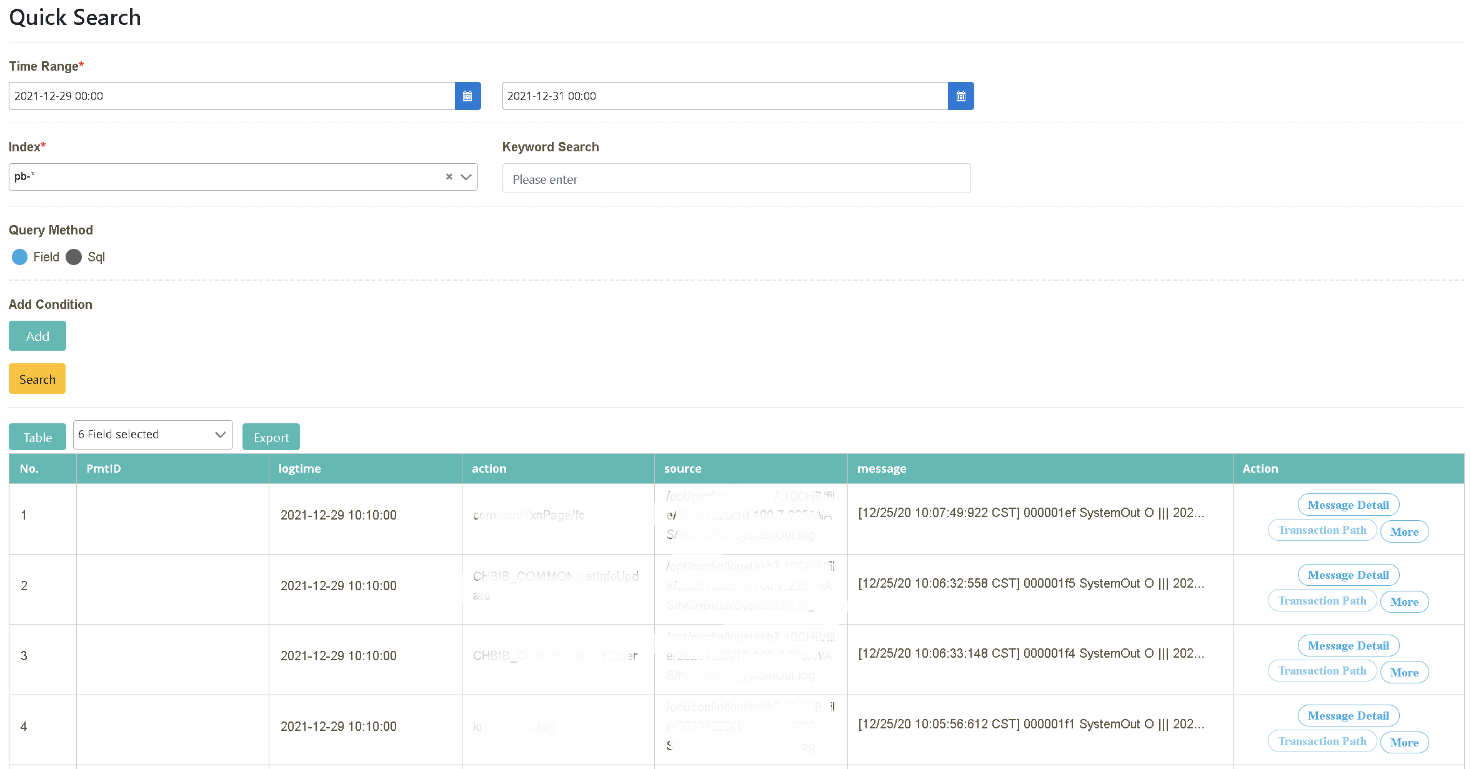
After logging in as bu02_dev, click on “Log Query” > “Log Query” to select the starting and ending time (2021/12/29~2021/12/31). Select the data source to be searched (Index=pb-*) and click [Query]. Check “No., PmtID, logtime, action, source, message” in the field.
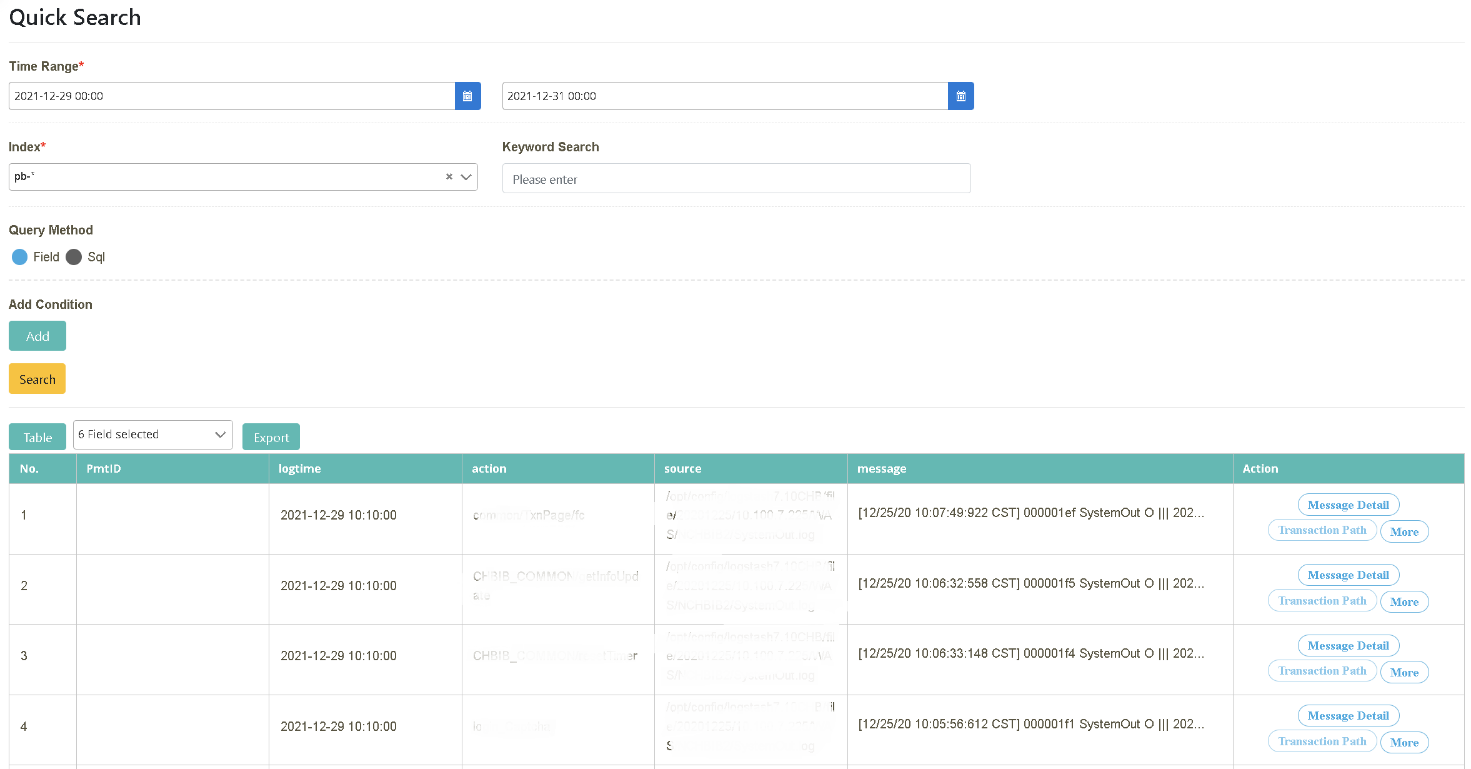
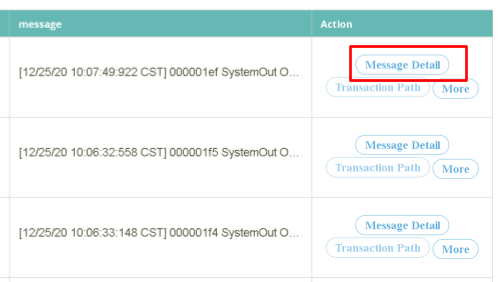
Move to the “Action” tab on the farthest right from the search result and click [Message Detailed Data].
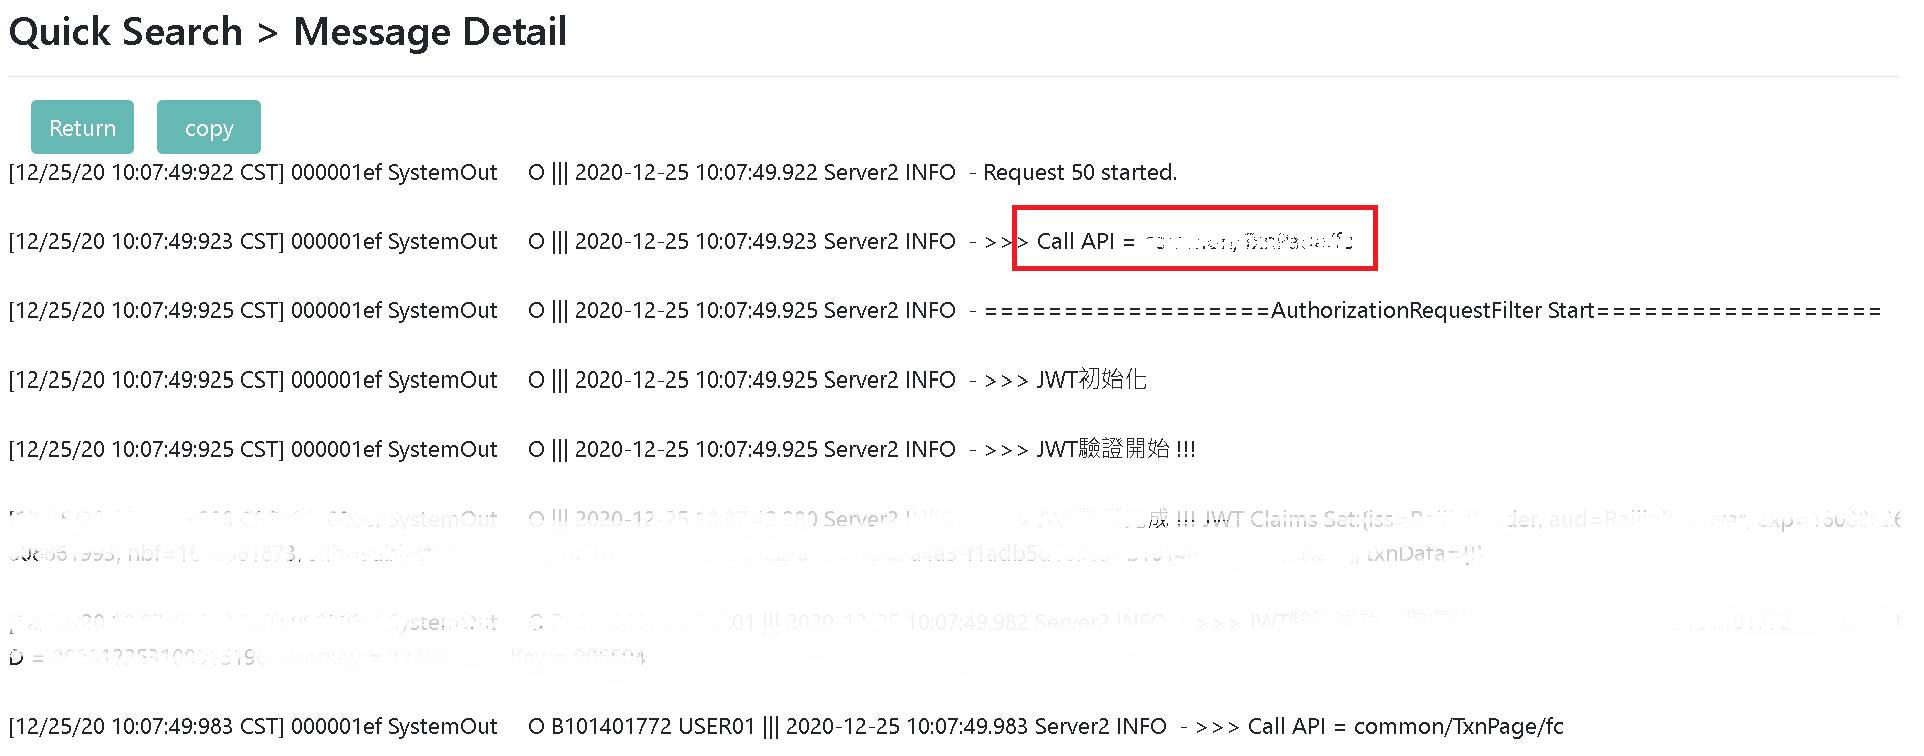
Look for the associated information in the systems one by one in “Message Detailed Data”. In this example, clues about Call API are found in the fifth data field. Lastly, depending on the requirement, search with “Keyword Query” and “Dynamic Query” to have even better search results with accuracy.

After logging in as bu02_dev, click on “Log Query” > “Log Query” to select the starting and ending time (2021/12/29~2021/12/31). Select the data source to be searched (Index=pb-*) and click [Query]. Check “No., PmtID, logtime, action, source, message” in the field.
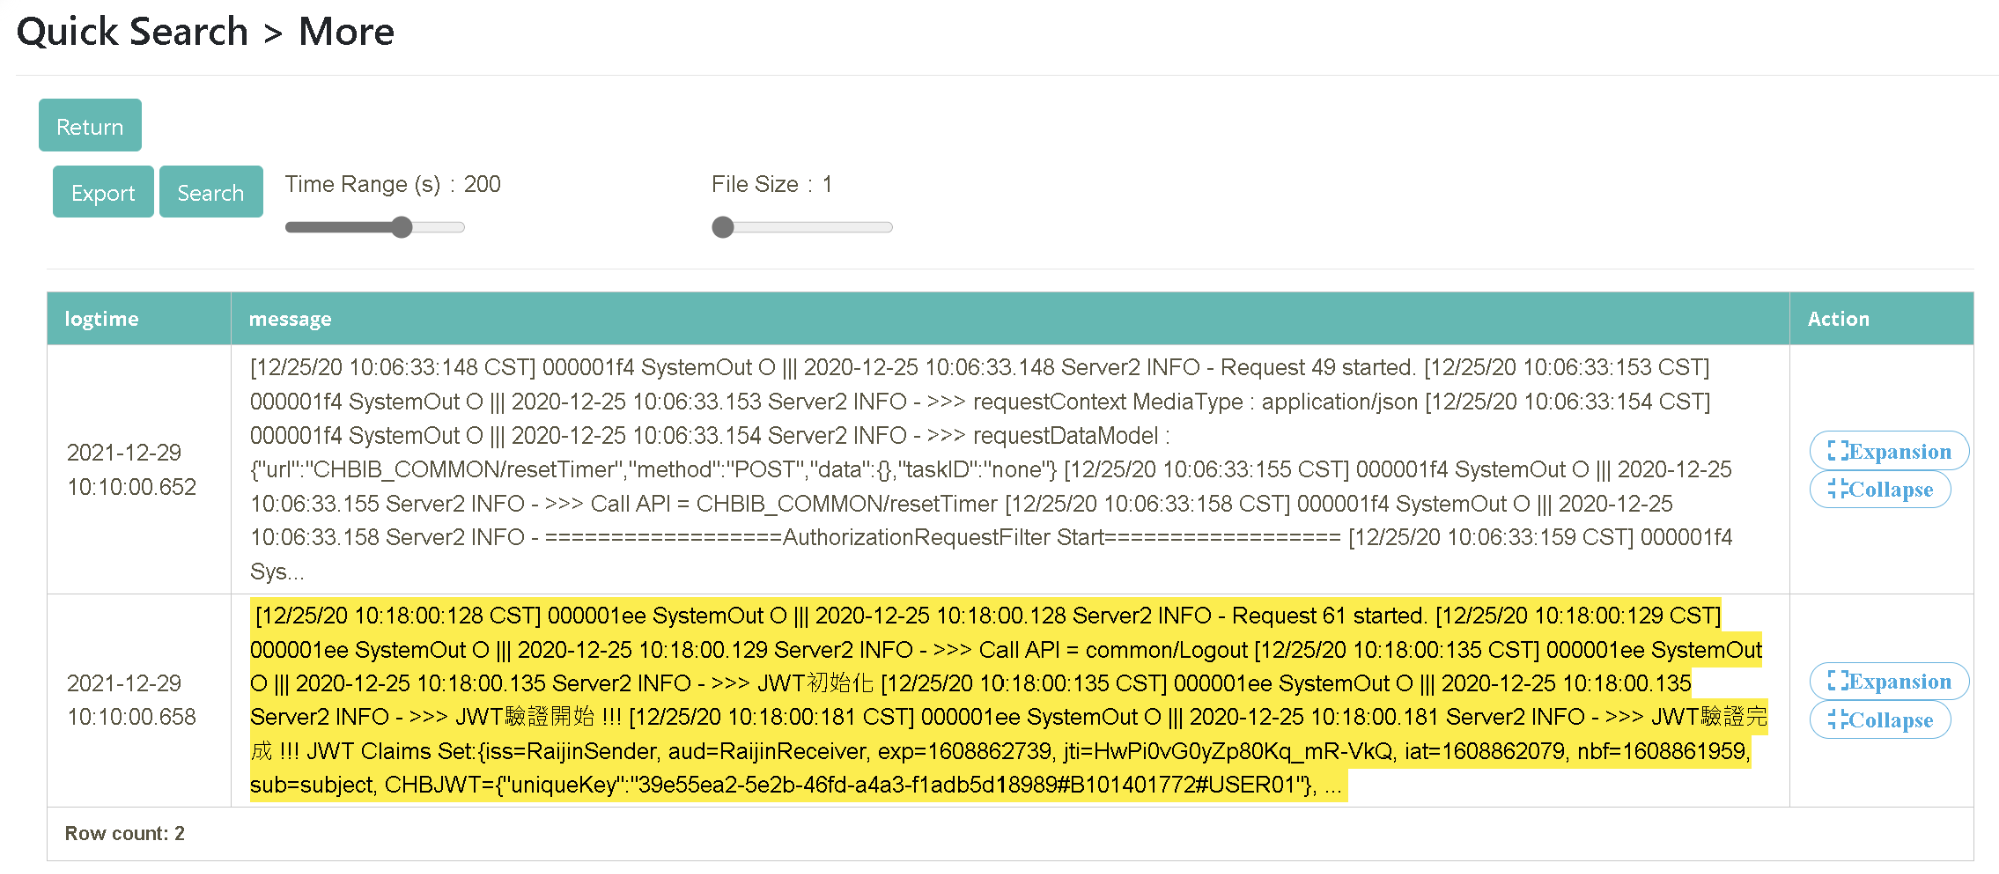
Select PmtID=2020122531279601 from “Actions” and click [More Query]. Drag and drop to set the time range (Time Range(s)=200, File Size=1) and click [Query]
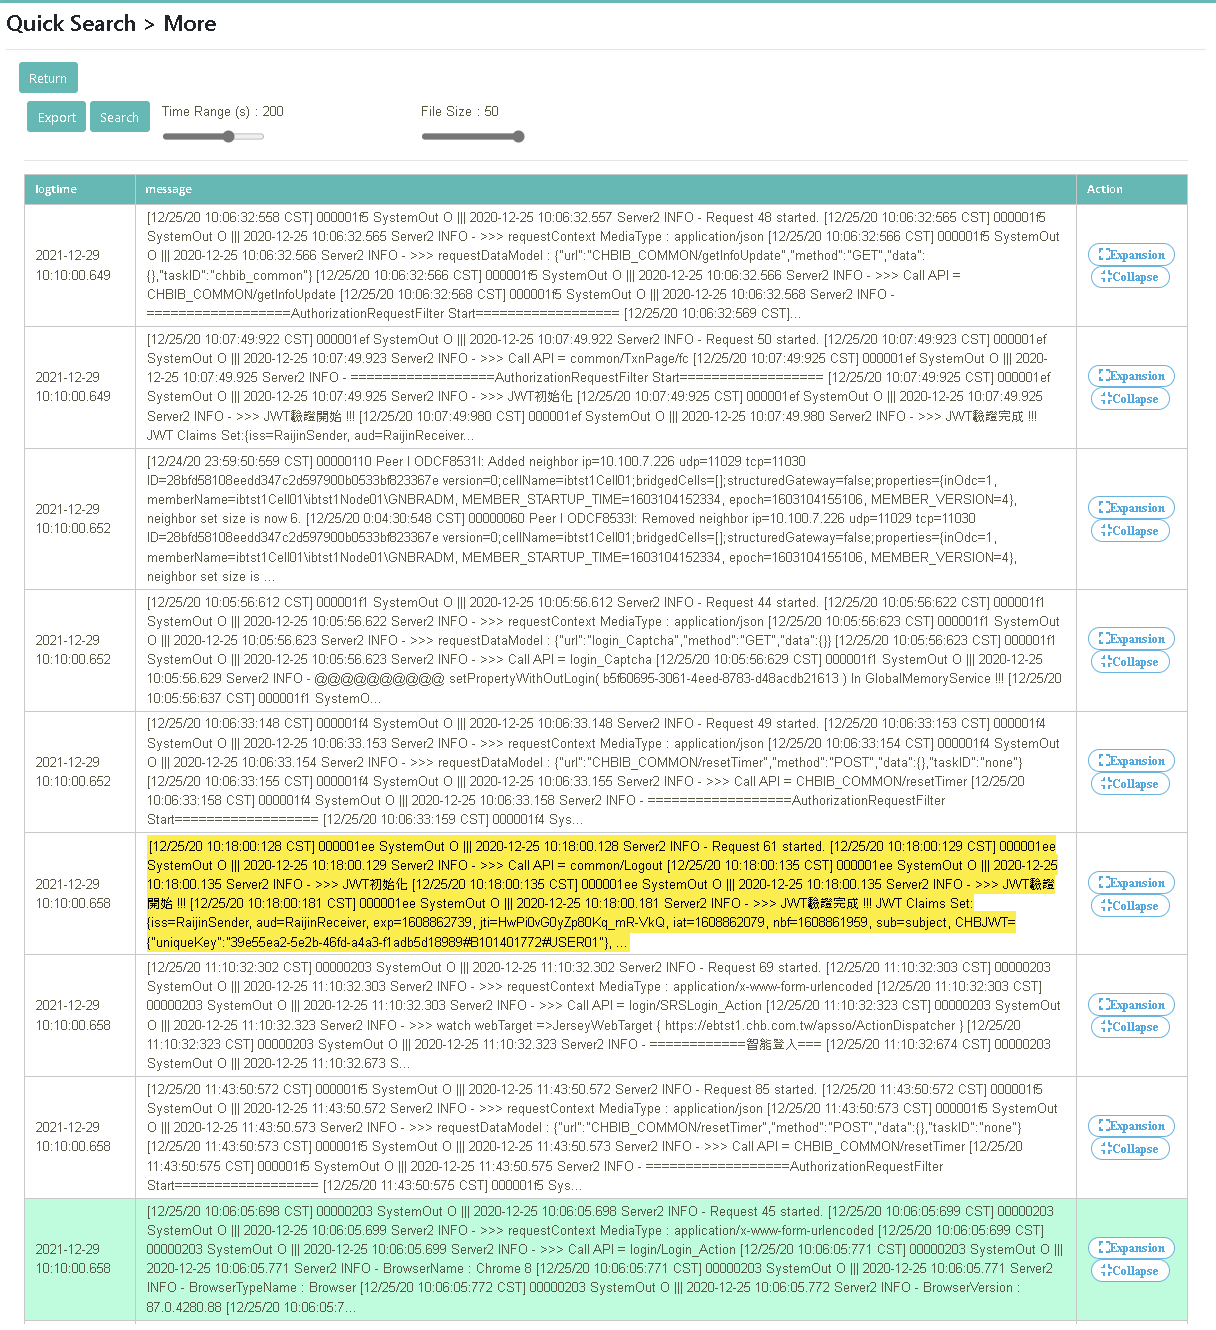
Drag and drop to set the time range (Time Range(s)=200, File Size=50) and click [Query]
In this scenario, you can learn how to do real-time queries directly on the platform through “Log Query” after reactivating the archived “Historical Data” in digiLogs.
In the past, the MIS team would package and compress historical data. When you need to search past data, you would need to decompress the entire package and search the data files with a target date one at a time. Not only did the search take a long time, but the process was also troublesome. digiLogs now provides an easier solution for enterprises as the platform divides the data into cold and hot data according to the elapsed time of the data storing date. When you need to query cold data, you can reactive the setting through “Query Index” in order for the data to be queried temporarily.

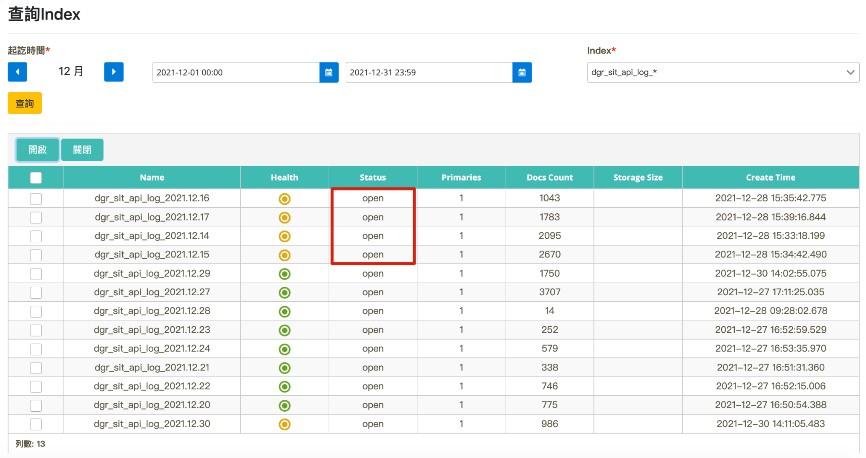
After logging in as bu02_dev, click on “Index Management” > “Query Index” to select the starting and ending time (2021-12-01~2021-12-31). Select the data source to be queried (index=dgr_sit_api_log_*) and click [Search].
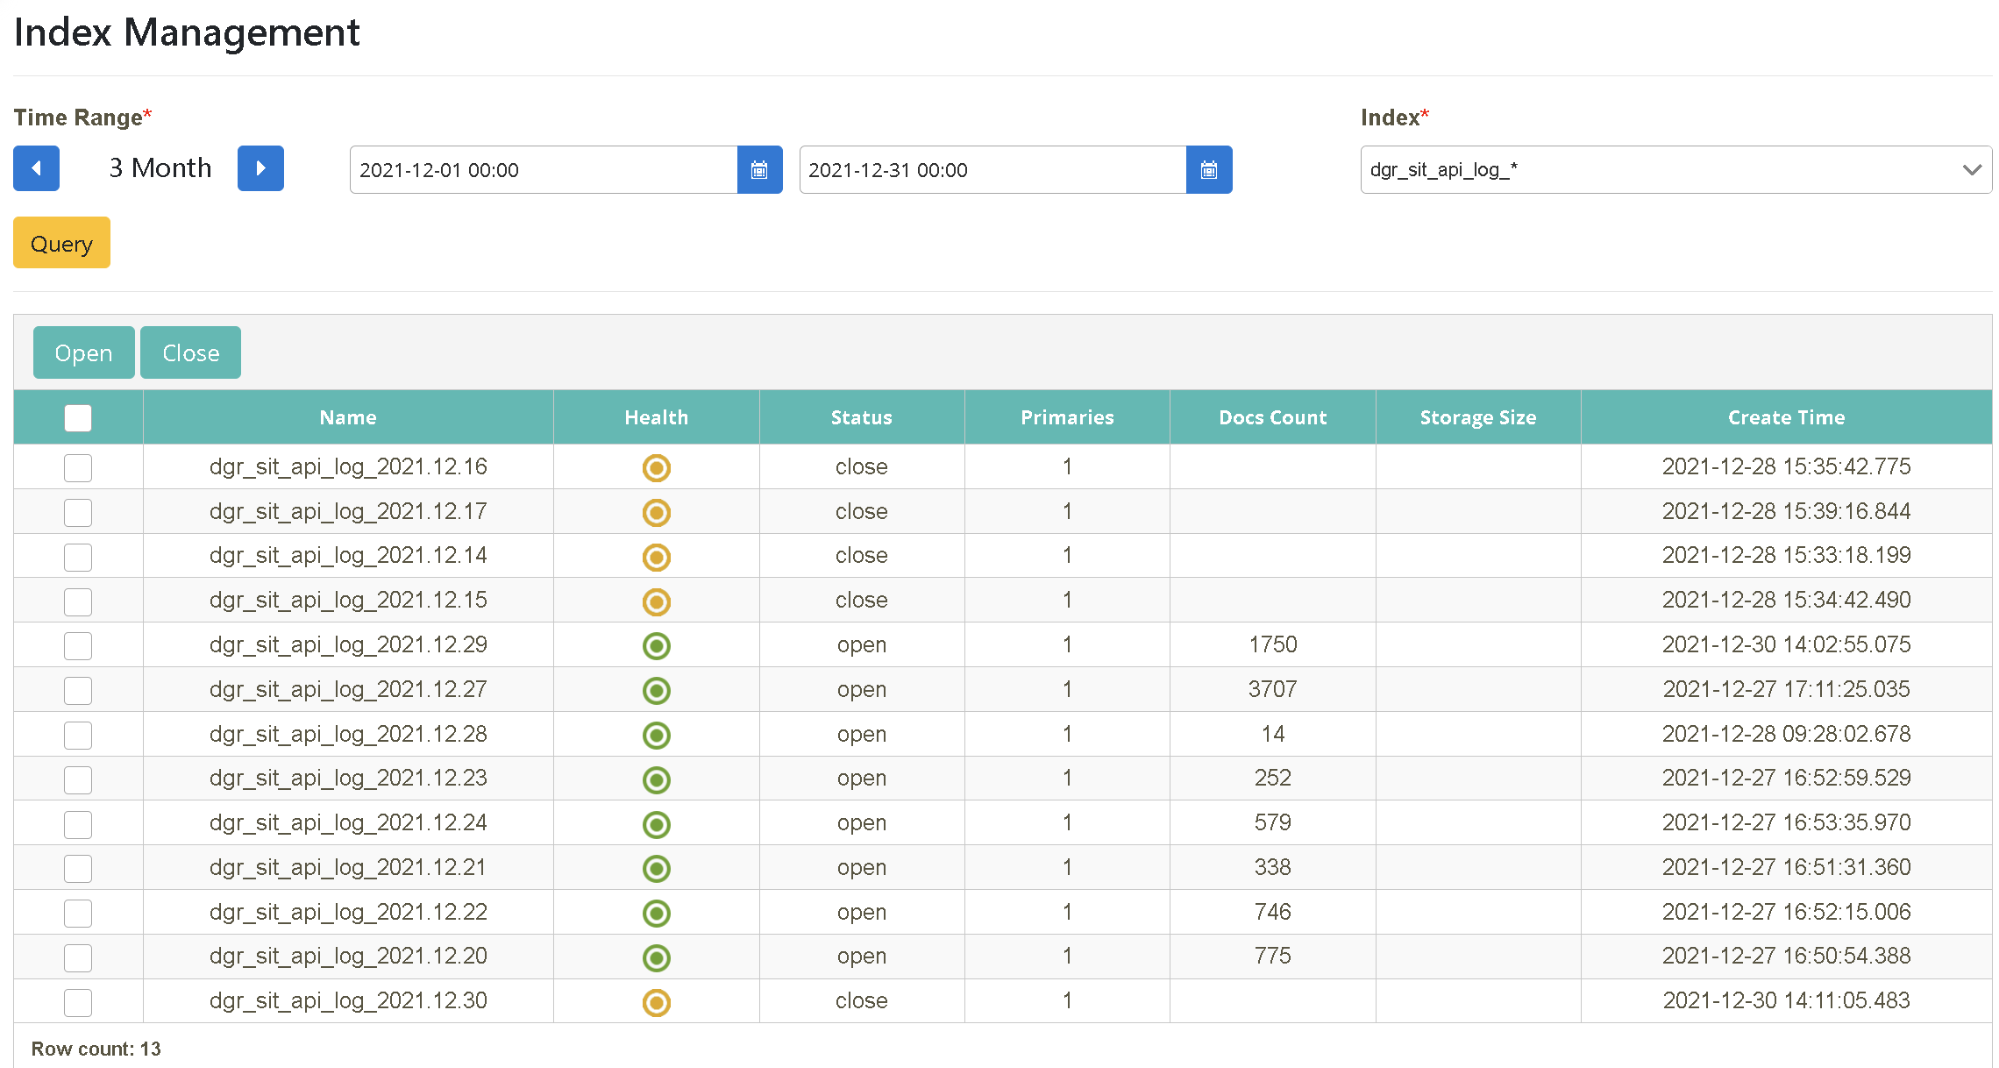
Select the date to be searched (2021-12-01~2021-12-31). Select the data source to be queried (Index=dgr_sit_api_log_*) and click [Search]. Select the date you want to open and click [Open].
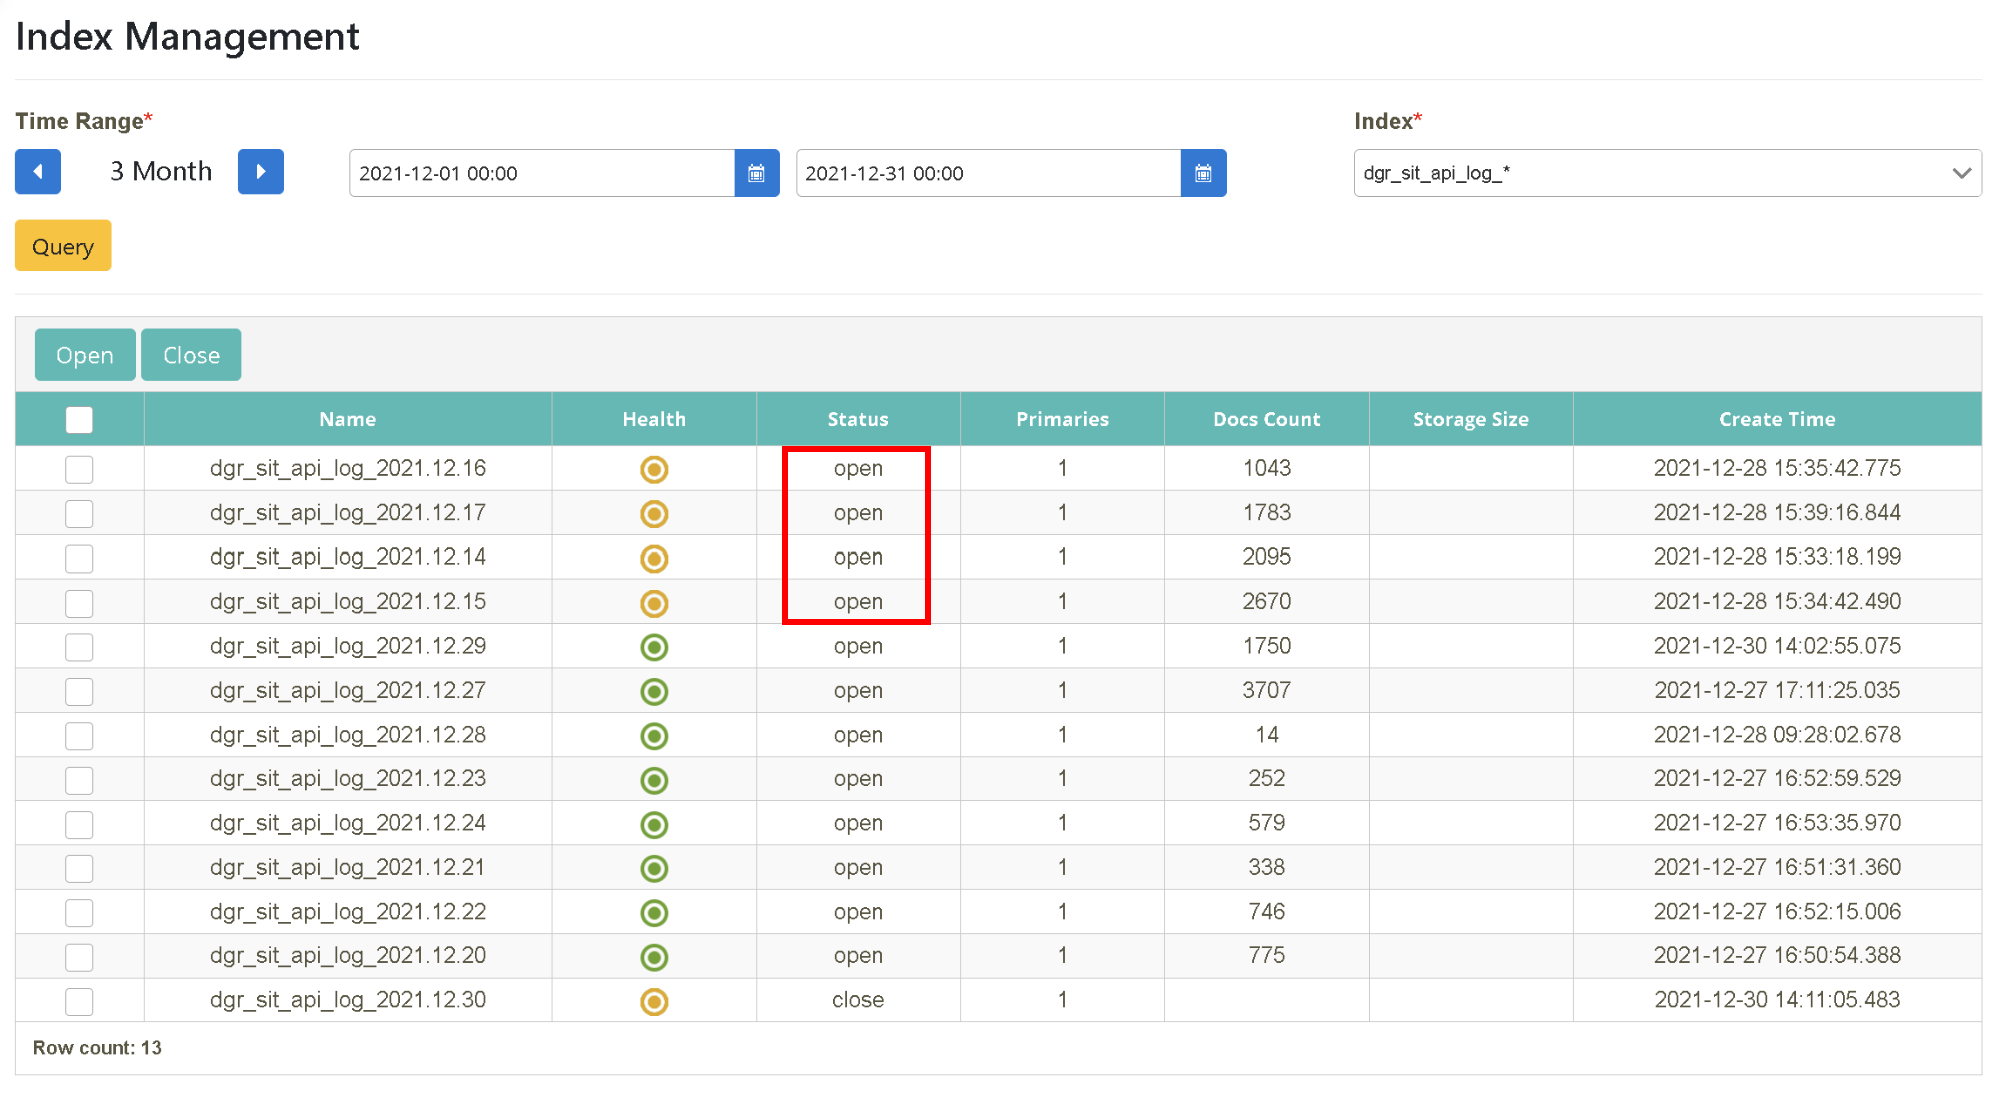
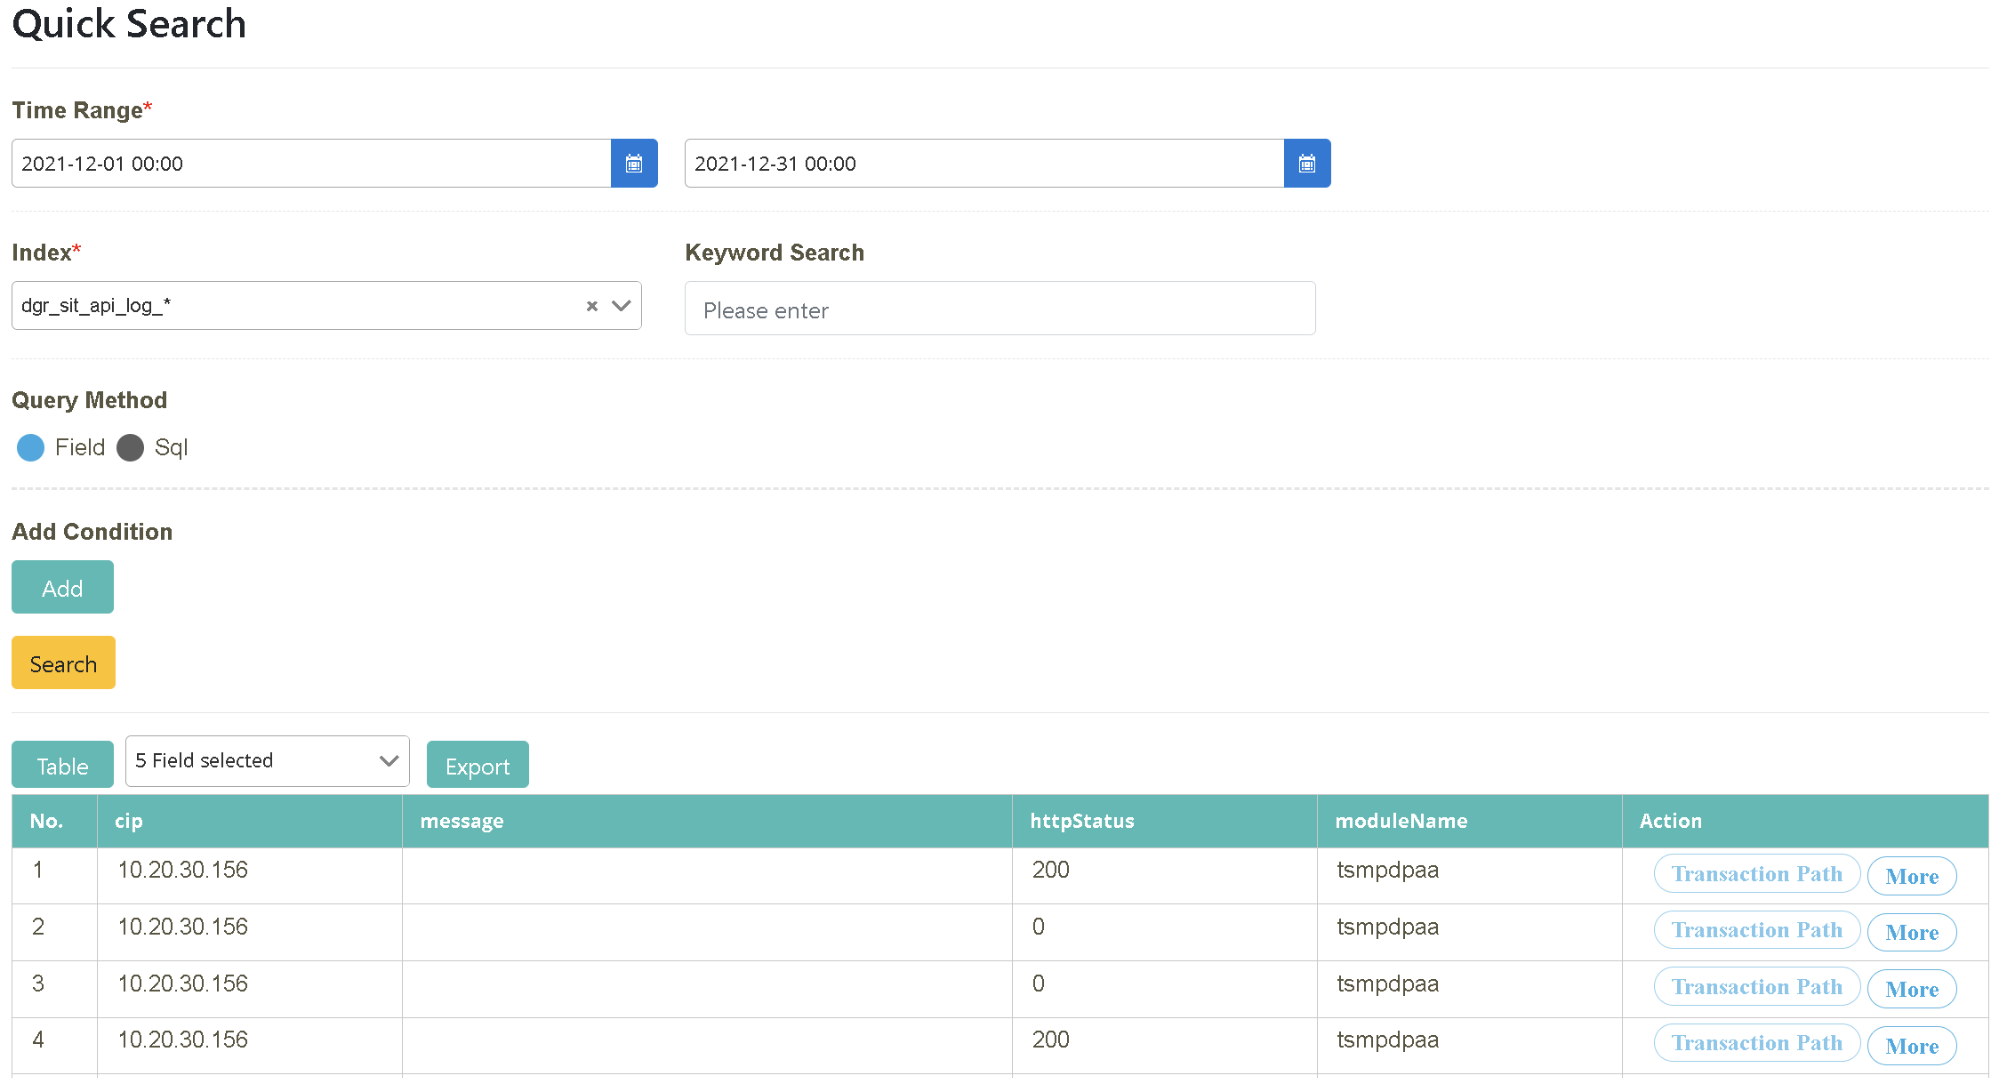
Click on “Log Query” > “Log Query” to select the starting and ending time (2021-12-01~2021-12-31). Select the data source to be queried (Index=dgr_sit_api_log_*) and click [Search].
In this scenario, you can find out how digiLogs can assist enterprises in doing “Read File” hosting. When it is set, you can use it directly out of the box on the platform, and monitor the enterprise log files in real-time.
Manager Wang introduced the digiLogs centralized management platform to easily manage system data records of various hardware and software through a single interface, reducing the time cost of query for the team and improving management efficiency effectively.
digiLogs provides the hosting function “Read File” to help enterprises fulfill the expectations of “Logs Management Center”. It can eliminate the traditional process of entering the entire data of configuration (IP, Port, ID, PWD, etc.) one at a time so that you can quickly switch and monitor the real-time data of Log files in a single interface provided after a one-time setup.
cat mode: It is a command used by Lunix to view the content of a file. It is often used to display the content of the entire file or to merge multiple files.
tail mode: It is also a command used by Lunix to view the content of a file. It is mainly used to display the last few lines of a file. Whenever the file content is updated, it recompiles automatically so that the file content data always reflect the latest update.

Click on “Read File Management” > “Host Maintenance” and click [Add A New Host]


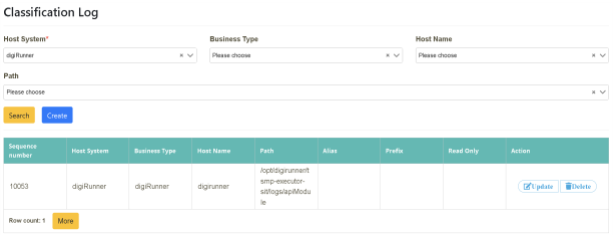
Click on “Read File Management” > “Categorized Log Maintenance”. Click [Create]

Enter the “main system, business type, hostname, path, and other data” to be used in the corresponding field and click [Create].

(To see the obvious difference, please choose an earlier date as the starting and ending dates for the search)
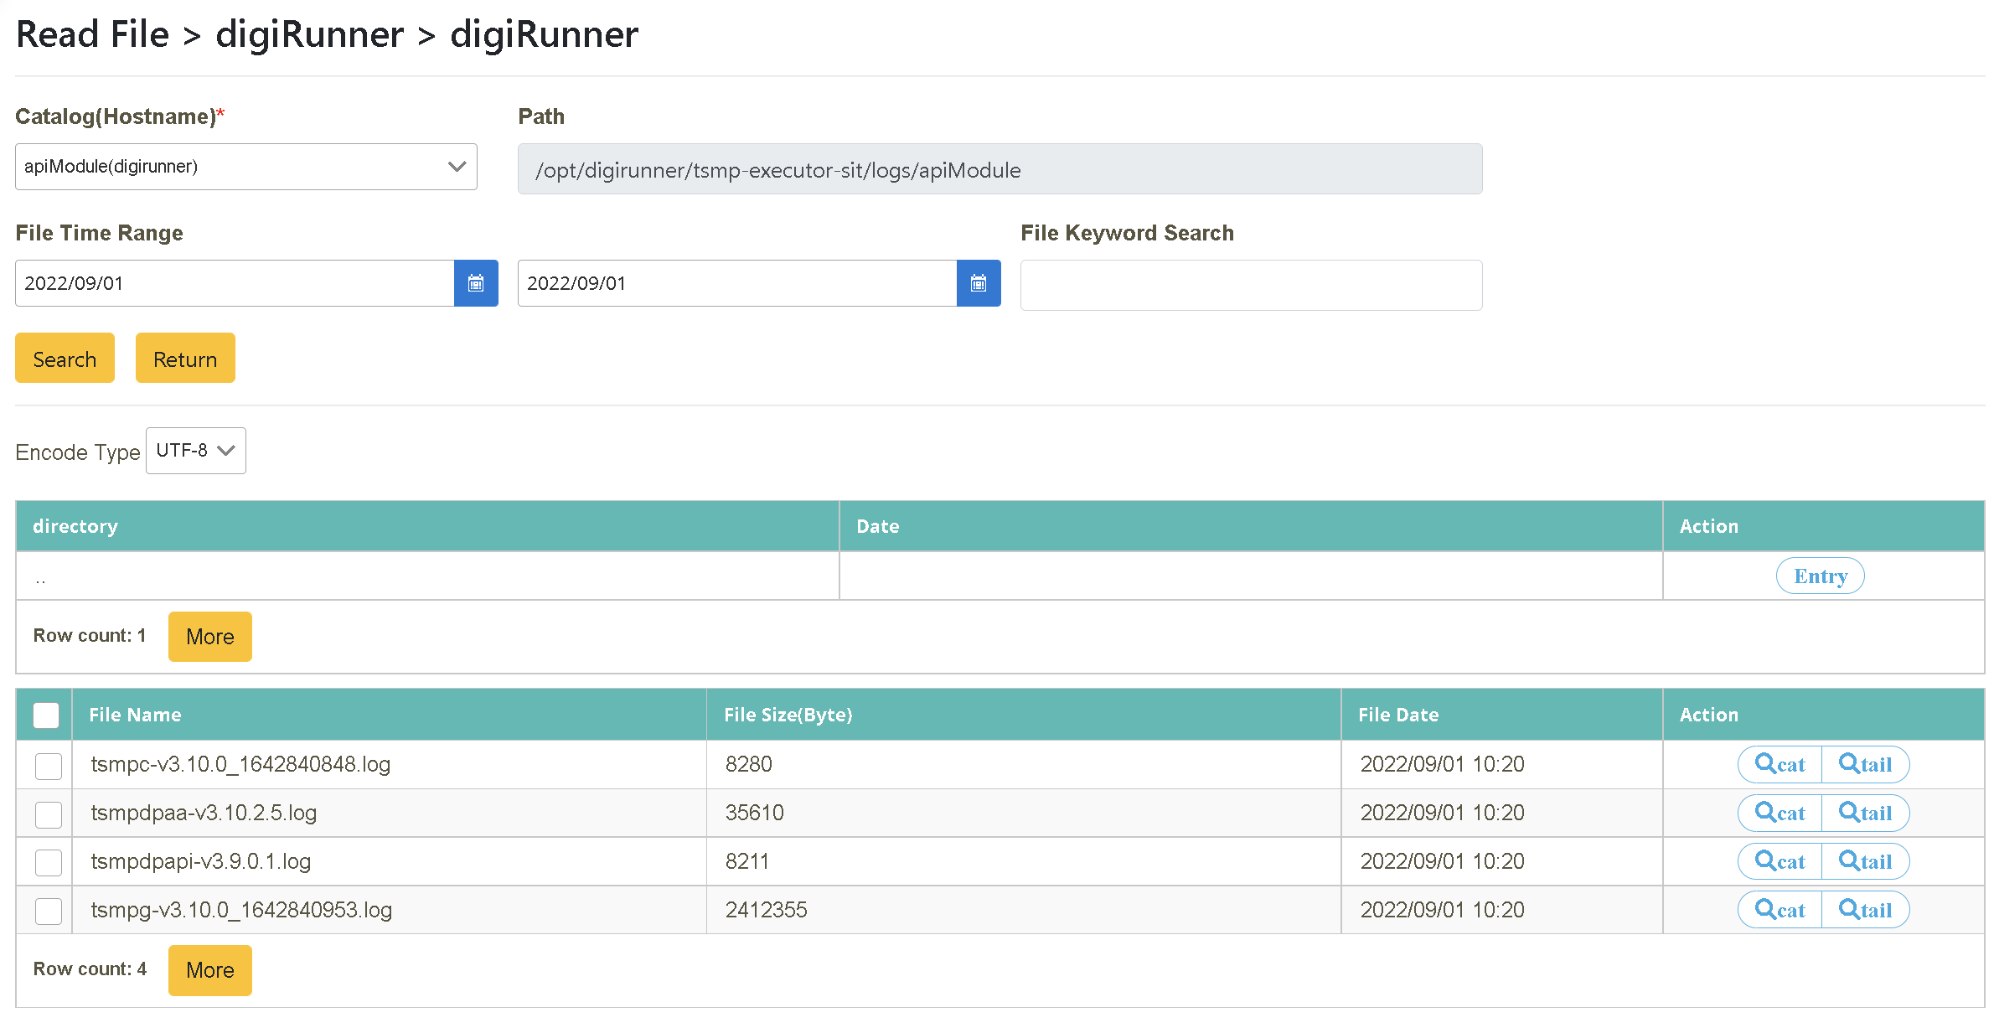
Select cat mode. After locating the target file name (need to select a file with “.log” as its extension name), click [Preview] in the “action” tab. This action performs a complete content search in a single window.
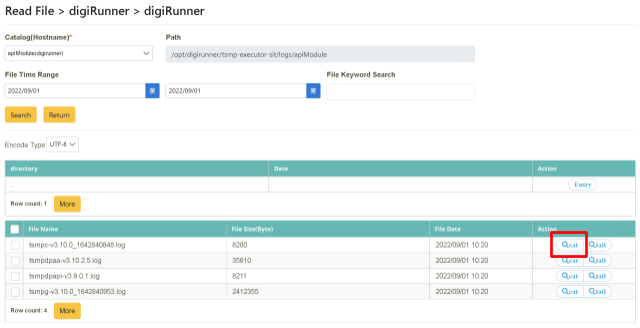
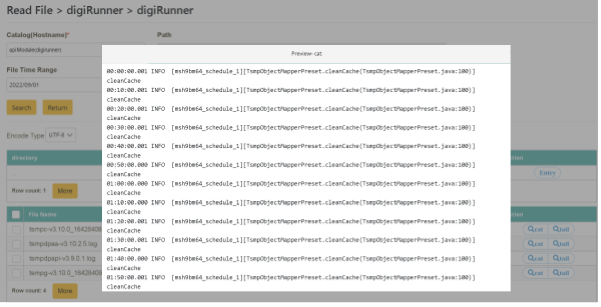
(To see the obvious difference, please search the current date as the start and end dates)
Click on “Log Query” > “Read File” to select the target “system” and “business”, and then select the target “Directory (host)” (host=apiModule (digirunner)). Select the starting and ending time to be searched, or enter the content to be searched in “Keyword Search” (dtsmpc-v3.10.0) and click [Search].
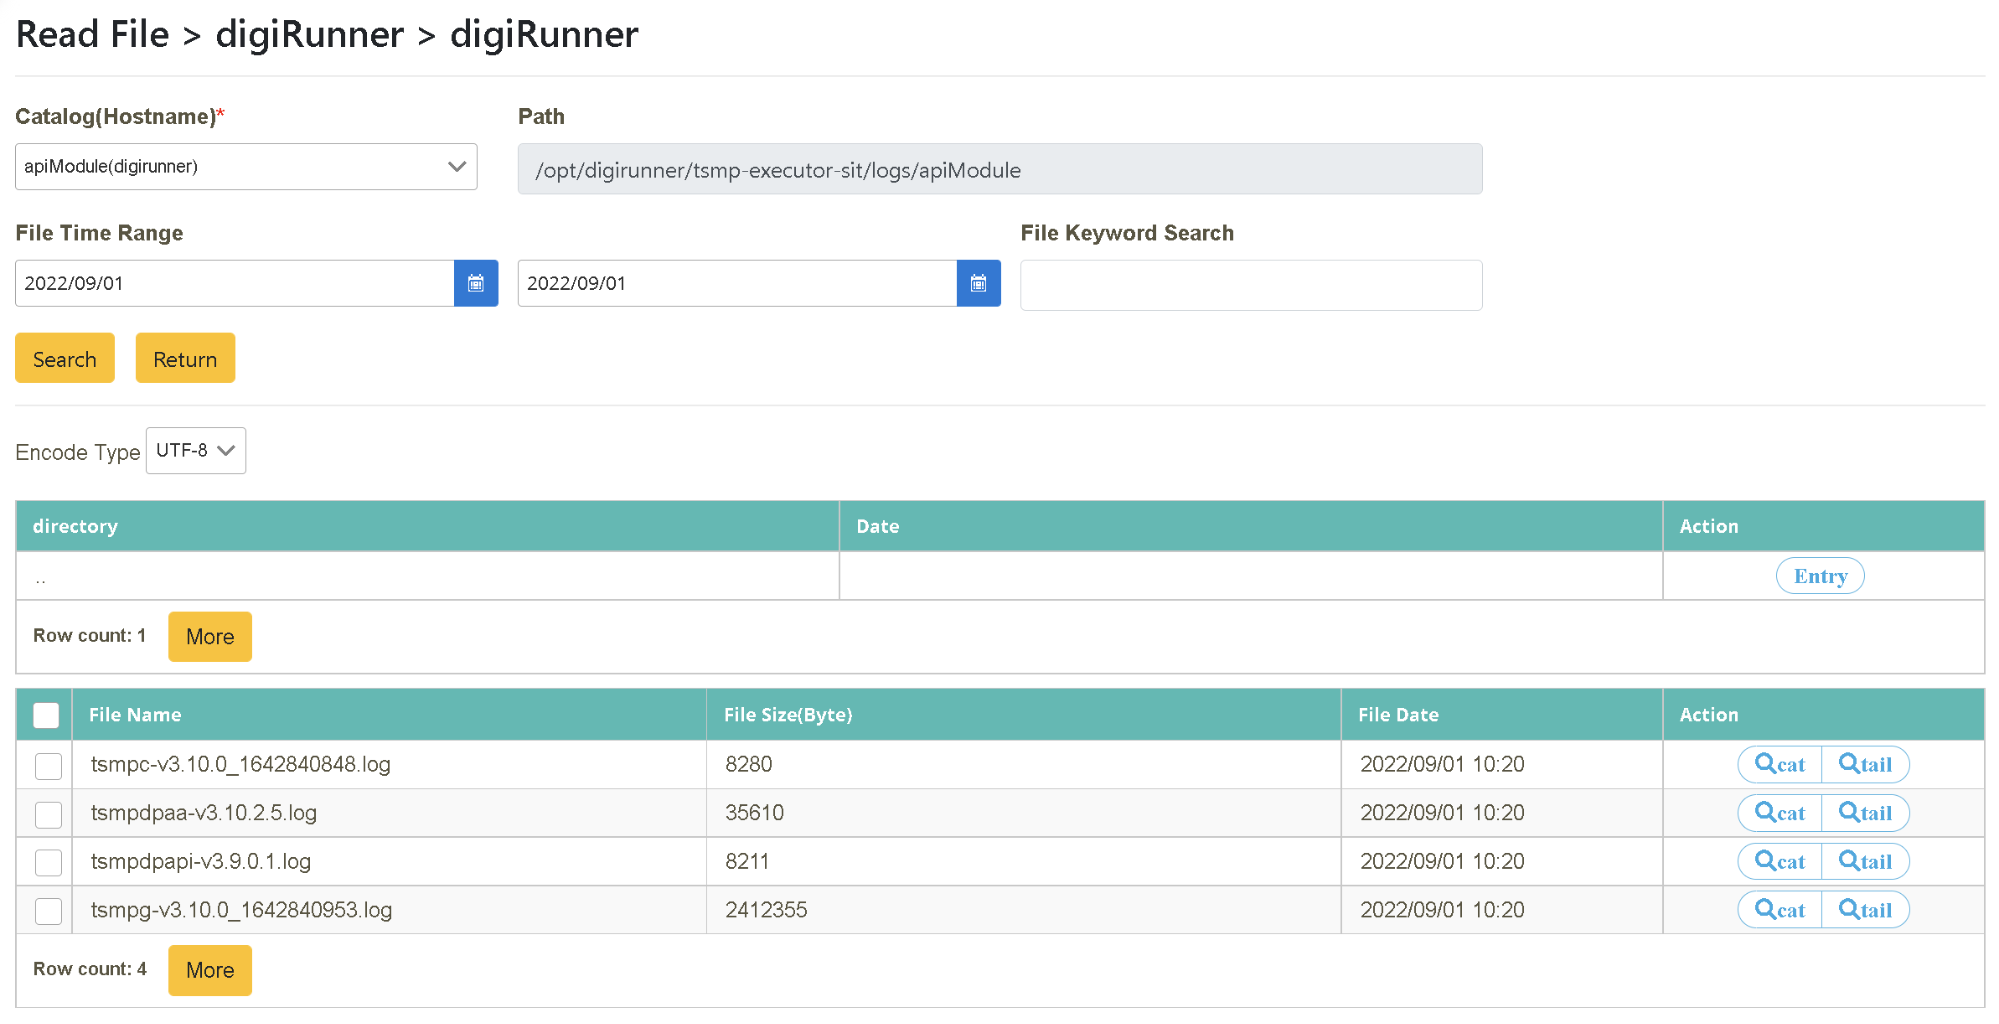
Select tail mode. After locating the target file name (need to select a file with “.log” as its extension name), click [Preview] in the “action” tab. This action will perform a content search of the last few lines in a single window. Whenever the file content is updated, it automatically updates and displays in this window.
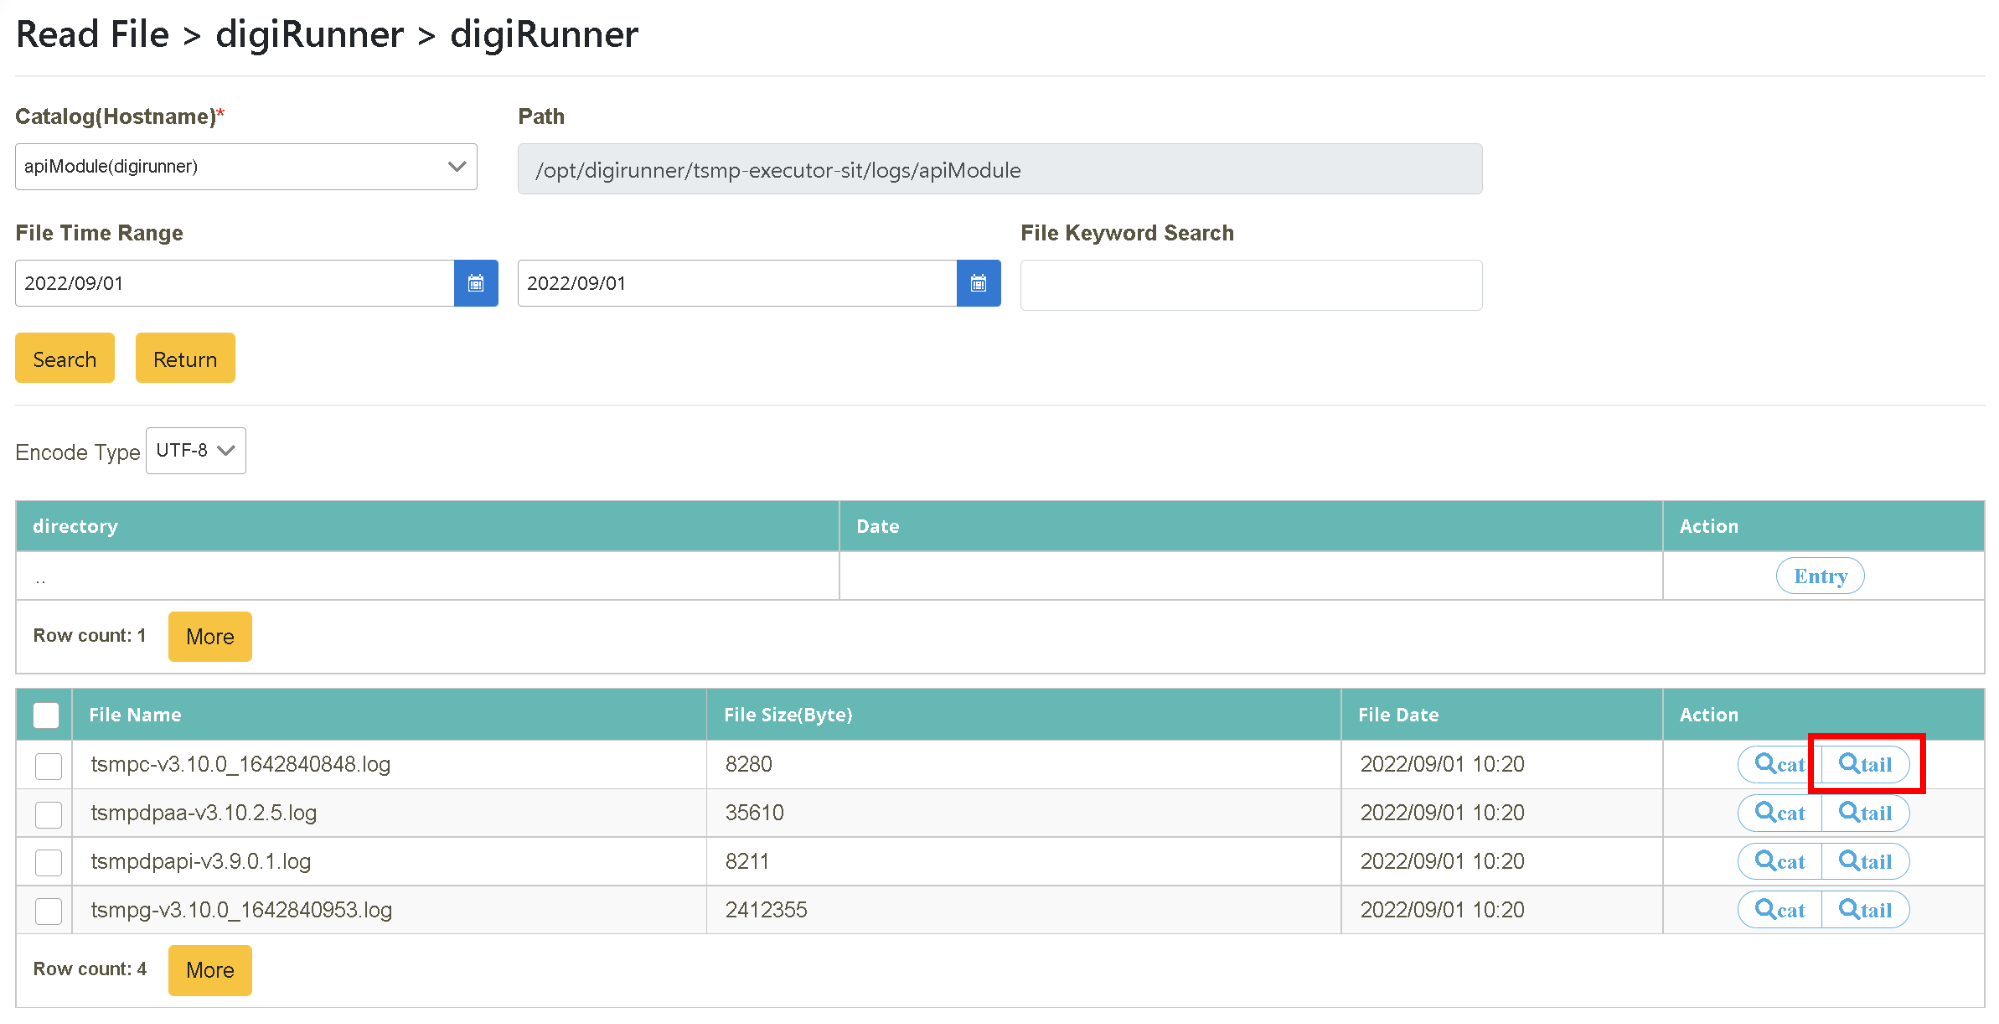
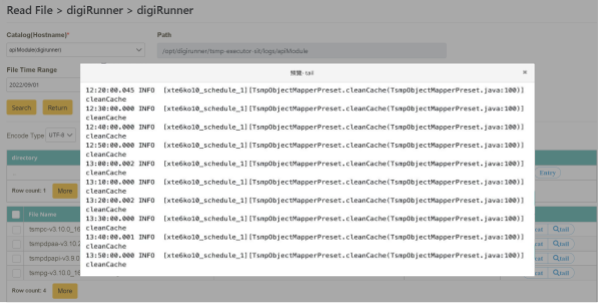
You can switch between cat and tail modes according to your needs in the search results, which support multiple character encodings (BIG 5, UTF-8, ASCII).